

Highlights
- Procter & Gamble Health shares surged 12.28% after the latest Q4 FY26 earnings announcement.
- The company reported standalone net profit of ₹9,460.00 lakh for the March 2026 quarter.
- Traders are closely watching whether the stock can sustain above the ₹5,900.00 support zone.
Overview
Procter & Gamble Health Limited (NSE: PGHL) emerged among the top gainers on May 27, 2026, after the stock climbed 12.28% to ₹6,346.50. The rally followed the company’s latest quarterly earnings announcement, which attracted strong market attention amid elevated trading activity.
The stock opened at ₹5,949.00 and touched an intraday high of ₹6,700.00 before trading near current levels. The sharp move also pushed the stock into the exchange’s active gainers list during the session.
Fundamental View
For the quarter ended March 2026, Procter & Gamble Health reported standalone total income of ₹37,445.00 lakh. Profit before tax stood at ₹13,321.00 lakh, while net profit came in at ₹9,460.00 lakh. Earnings per share for the quarter was reported at ₹56.99.
The earnings announcement was released on May 26, 2026. Market participants appeared to react positively to the quarterly update, with the stock witnessing a notable jump in price and trading interest during the session.
Technical View
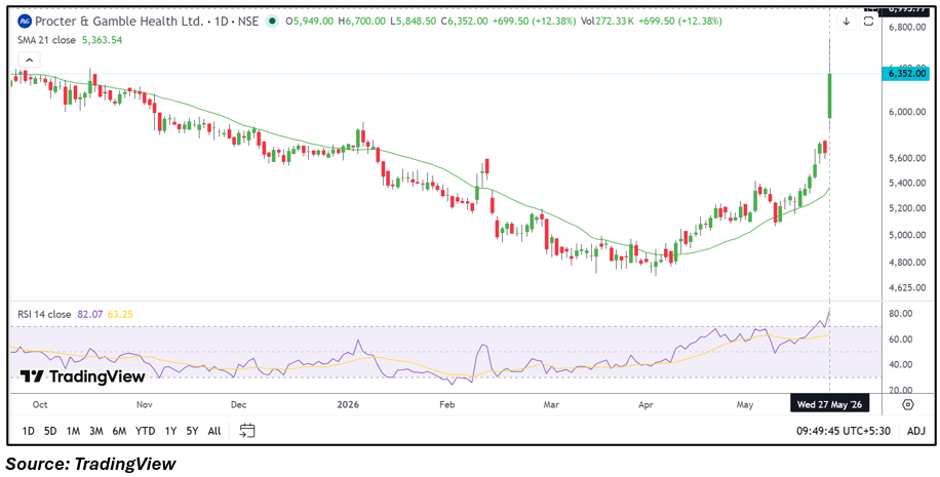
Procter & Gamble Health stock witnessed a sharp upward move and traded near ₹6,346.50 during the latest session. The stock remains well above its 21-day SMA near ₹5,363.54, reflecting a significantly improved near-term structure.
Recent price action indicates strong upward momentum after the earnings-driven breakout move. The 14-day RSI moved near 82.07, entering the overbought region and indicating elevated momentum conditions.
Immediate support is placed in the ₹5,900.00–₹5,500.00 zone. On the upside, resistance is seen around ₹6,700.00–₹7,000.00, which may remain an important area for traders in the near term.
Key Technical Levels
Procter & Gamble Health is currently holding above its short-term support region near ₹5,900.00–₹5,500.00 after the sharp post-results rally. The stock has also moved significantly above its moving average zone, reflecting improved momentum conditions. On the higher side, the ₹6,700.00–₹7,000.00 range remains a key resistance area that traders may monitor closely over the coming sessions.
Risks to Watch
- Sharp rallies may lead to short-term profit booking pressure.
- RSI near overbought levels may increase volatility risk.
- Failure to hold above support may weaken momentum conditions.
- Broader market weakness could impact near-term sentiment.
Summary
Procter & Gamble Health shares gained sharply after the company announced its Q4 FY26 earnings, pushing the stock into the top gainers list. The stock is currently trading above key support levels with momentum indicators remaining elevated. Traders are now watching whether the rally can sustain near the ₹6,700.00–₹7,000.00 resistance zone following the strong earnings reaction.
FAQs
Why did Procter & Gamble Health shares rise today?
The stock rallied after the company announced its latest Q4 FY26 earnings and attracted strong market participation.
What are the key support levels for PGHL stock?
Immediate support is placed around the ₹5,900.00–₹5,500.00 zone based on recent price action.
Which resistance levels are traders watching in PGHL shares?
Traders are closely monitoring the ₹6,700.00–₹7,000.00 region for further directional movement.