
Highlights
- SKYGOLD shares declined over 5% after a sharp rally to recent highs.
- The stock remains above its 50-day SMA despite the ongoing correction.
- Profit booking and cooling momentum indicators appear to be weighing on sentiment.
Overview
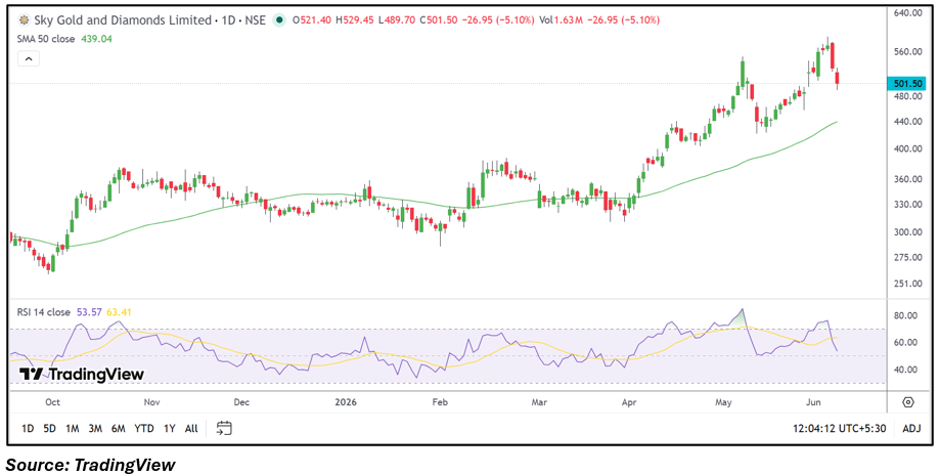
Sky Gold and Diamonds (NSE: SKYGOLD) fell 5.05% to ₹501.75 on June 8, 2026, emerging among the notable losers on the NSE. The stock touched an intraday low of ₹489.70 after recently climbing to fresh highs near ₹570.00. Despite the decline, SKYGOLD continues to trade comfortably above its 50-day Simple Moving Average (SMA) of ₹439.04, indicating that the broader trend remains positive even as short-term profit booking intensifies.
Fundamental View
Sky Gold and Diamonds reported solid financial performance for the quarter ended March 2026. The company posted total income of INR 1,38,448.65 lakh, profit before tax of INR 8,769.17 lakh, and net profit of INR 6,430.55 lakh. Earnings per share stood at INR 4.15. Investors may continue to monitor revenue growth, margins, and demand trends within the jewellery sector.
Technical View
SKYGOLD is trading at ₹501.75, well above its 50-day SMA of ₹439.04, suggesting that the larger trend structure remains intact. However, the stock has witnessed a sharp pullback after a strong advance over recent weeks. The 14-day RSI has cooled to 53.57 from higher levels, indicating moderation in momentum. Current price action points toward consolidation as traders evaluate whether the recent rally can sustain itself after the correction.
Momentum Indicator
The RSI reading of 53.57 remains above the neutral mark but has eased considerably from earlier elevated levels. This suggests momentum has slowed, though the stock has not yet entered a weak technical zone.
Key Technical Levels
At the current market price of ₹501.75, immediate support is placed near ₹476.65, followed by a stronger support zone around ₹451.60. On the upside, resistance is seen near ₹526.85, while the next resistance level is positioned around ₹551.90. The stock's ability to hold above support levels may determine whether the ongoing decline remains a correction within a broader uptrend.
Risks to Watch
- Profit booking after the recent sharp rally.
- Volatility linked to precious metal prices.
- Margin fluctuations within the jewellery business.
- Broader market weakness affecting mid-cap stocks.
Summary
Sky Gold and Diamonds is undergoing a correction after a powerful rally that pushed the stock to fresh highs. While short-term momentum has moderated and profit booking has emerged, the stock continues to trade above its 50-day SMA, keeping the broader trend constructive. Traders are likely to watch whether the stock can stabilize near key support zones before attempting another upward move.
FAQs
Why did SKYGOLD shares fall today?
The stock witnessed profit booking after a strong rally and recent move to higher price levels.
Is the long-term trend still positive?
The stock remains above its 50-day SMA, indicating the broader trend remains constructive.
What are the important levels to watch?
Support levels are ₹476.65 and ₹451.60, while resistance levels are ₹526.85 and ₹551.90.