
Highlights
- MODISONLTD declined nearly 5% after a sharp rally in recent sessions.
- The stock remains significantly above its 50-day moving average despite the pullback.
- Recent gains and elevated momentum may have triggered profit booking activity.
Overview
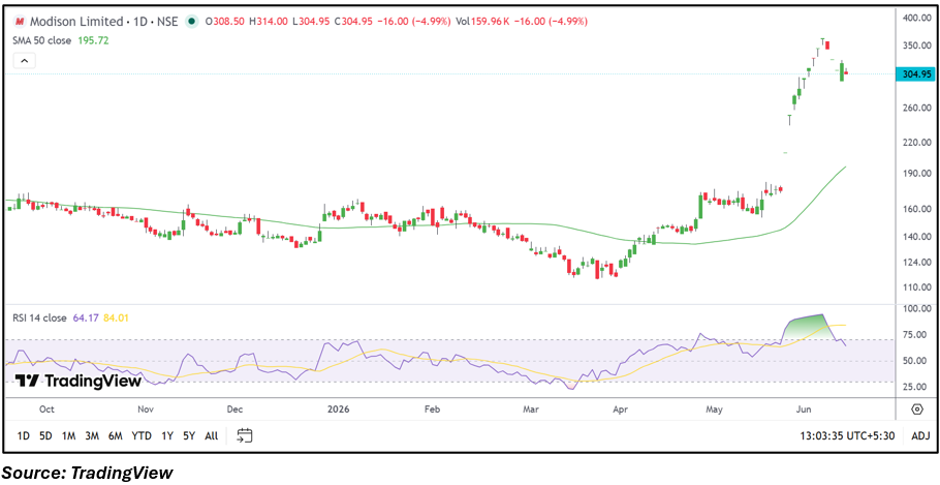
MODISON LIMITED (NSE: MODISONLTD) was trading at ₹304.95 on June 12, down 4.99% from the previous close. The decline comes after a powerful rally that pushed the stock toward the ₹350 mark earlier this month. While the latest move has placed the stock among the notable losers of the session, it continues to trade well above key medium-term trend levels.
Fundamental View
Modison reported consolidated total income of INR 28,911.95 lakh for the quarter ended March 2026. Profit before tax stood at INR 4,780.11 lakh, while net profit came in at INR 3,600.23 lakh. Earnings per share for the quarter were INR 11.09. The financial performance reflects profitability, although investors may also be evaluating valuations following the stock's recent price surge.
Technical View
MODISONLTD is currently trading at ₹304.95, down 4.99% in the session. Despite the decline, the stock remains above its 50-day SMA of ₹195.72, indicating that the broader trend remains positive. The recent correction follows a steep rally that lifted the stock from around ₹200 levels to above ₹350 within a short period. RSI stands near 64, easing from overbought territory, suggesting momentum has cooled after the sharp advance. Price action indicates a phase of consolidation as traders reassess the stock following its rapid rise.
Momentum Indicator
The RSI has retreated from elevated levels but remains above the neutral 50 mark. This suggests that while momentum has moderated, the stock has not yet entered a weak technical structure. Investors may watch whether RSI stabilizes near current levels or continues to decline.
Key Technical Levels
At the current market price of ₹304.95, immediate support is placed around ₹289.70, while the next important support zone is near ₹274.45. On the upside, resistance is seen around ₹320.20, followed by a higher hurdle near ₹335.45. A sustained move above resistance could revive upward momentum, whereas a break below support may lead to additional consolidation.
Risks to Watch
- Sharp profit booking after recent rally.
- Elevated valuation metrics compared with earnings.
- Increased volatility following rapid price movement.
- Liquidity risks due to sharp short-term swings.
Summary
MODISONLTD has witnessed a healthy pullback after a substantial rally in recent weeks. While the stock corrected nearly 5% during the session, it continues to trade comfortably above its 50-day moving average, keeping the broader trend intact. Investors may focus on whether the stock stabilizes near support levels as momentum cools from previously elevated readings.
FAQs
- Why did MODISONLTD fall today?
The stock witnessed profit booking after a sharp rally that pushed it to recent highs. - Is the broader trend still positive?
The stock remains above its 50-day moving average, indicating the medium-term trend remains constructive. - What levels should investors watch?
Key support zones are near ₹289.70 and ₹274.45, while resistance is around ₹320.20 and ₹335.45.