
TCI Finance (NSE: TCIFINANCE) attracted market attention on June 11 after the stock surged 10% to ₹25.30 and featured among the day's top gainers on the NSE. The move came alongside increased trading activity and extended the stock's recent upward momentum.
Highlights
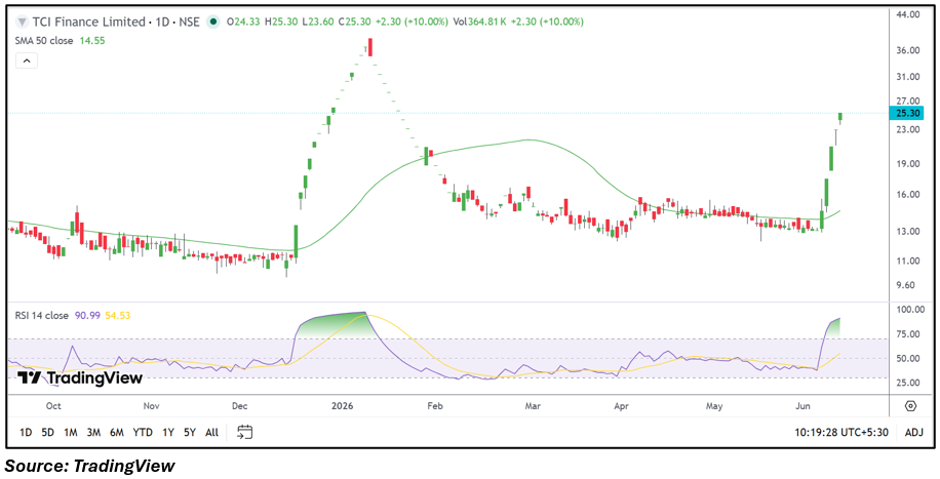
- TCI Finance shares jumped 10.00% to ₹25.30 during Thursday's session.
- The stock trades well above its 50-day SMA of ₹14.55.
- RSI moved above 90, reflecting a sharp acceleration in momentum.
Overview
TCI Finance witnessed a strong rally as traders responded to continued price strength. The stock touched an intraday high of ₹25.30 after opening at ₹24.33, while volumes remained elevated compared with recent sessions. The sharp move has placed the stock on investors' watchlists as it attempts to extend gains.
Fundamental View
For the quarter ended March 2026, TCI Finance reported total income of ₹48.14 lakh and a net profit of ₹10.50 lakh. Earnings per share stood at ₹0.08. While profitability remained positive during the quarter, the company remains a relatively small-cap financial services player, making price movements susceptible to liquidity-driven swings.
Technical View
TCI Finance is trading at ₹25.30, significantly above its 50-day SMA of ₹14.55, indicating a strong medium-term upward trend. The stock has witnessed a sharp vertical rise over the past few sessions and is currently trading near its session high. The price structure remains positive after breaking out from a prolonged consolidation phase.
Momentum Indicator
The 14-day RSI stands near 90.99, reflecting exceptionally strong momentum. While this highlights aggressive price acceleration, it also suggests the stock has entered an overextended zone where volatility may increase.
Key Technical Levels
TCI Finance is finding immediate support near ₹23.60, while a deeper pullback could bring ₹21.00 into focus. On the upside, the stock faces an immediate hurdle around ₹25.30, and a sustained move above this level could open the door toward ₹28.00.
Key Risks to Watch
- Elevated RSI may trigger short-term volatility.
- Low earnings base could impact sentiment.
- Liquidity-driven price swings may remain high.
- Sharp rallies can attract profit-booking pressure.
Summary
TCI Finance emerged as one of the session's strongest performers after gaining 10% and extending its recent uptrend. The stock remains well above its 50-day SMA, while momentum indicators reflect rapid price acceleration. Although the technical setup remains constructive, traders may closely monitor volatility given the sharp rise and elevated RSI levels.
FAQs
Why did TCI Finance shares rise today?
The stock gained 10% amid strong momentum and increased trading activity, placing it among the session's top gainers.
What is the current technical trend for TCIFINANCE?
The stock is trading above its 50-day SMA and remains in a positive short-term price structure.
What should investors watch next?
Investors may track volume trends, price sustainability above breakout levels, and any signs of profit booking.