

Highlights
- ABM International Limited (NSE: ABMINTLLTD) rose 20.00% to ₹52.56 during August 11, 2026 trading.
- The stock opened at ₹52.56 and recorded the same level as its intraday high, with a low of ₹47.99.
- The latest available March quarter results showed total income of ₹14.50 crore and net profit of ₹1.69 crore.
- The stock is trading above its 50-day SMA of ₹42.74, while RSI has moved to 72.03.
- Trading volume stood at approximately 15.13 thousand shares, with VWAP at ₹51.68.
- Investors should monitor the ₹52.56 level, trading volumes, RSI and price behaviour around the 50-day SMA.
Overview
ABM International Limited (NSE: ABMINTLLTD) is engaged in its operating business activities across its relevant segments. The stock jumped 20.00% to ₹52.56 on August 11, 2026, compared with the previous close of ₹43.80. It opened at ₹52.56 and also touched an intraday high of ₹52.56, while the day's low was ₹47.99. VWAP stood at ₹51.68. The stock's latest movement represents a sharp one-day increase and places it at the upper circuit level. The price has also moved considerably above its 50-day moving average, while the elevated RSI reflects increased short-term momentum.
Fundamental View
For the quarter ended March 31, 2026, ABM International reported consolidated total income of ₹14.50 crore, profit before tax of ₹1.54 crore and net profit of ₹1.69 crore. Earnings per share stood at ₹1.91. These figures represent the latest available financial results and provide a reference point for evaluating the company's earnings profile. Future quarterly results will be important for assessing revenue growth, operating margins, profitability and cash-flow generation. Investors should also monitor whether earnings remain consistent and whether the company can sustain its reported financial performance in subsequent periods.
Technical View
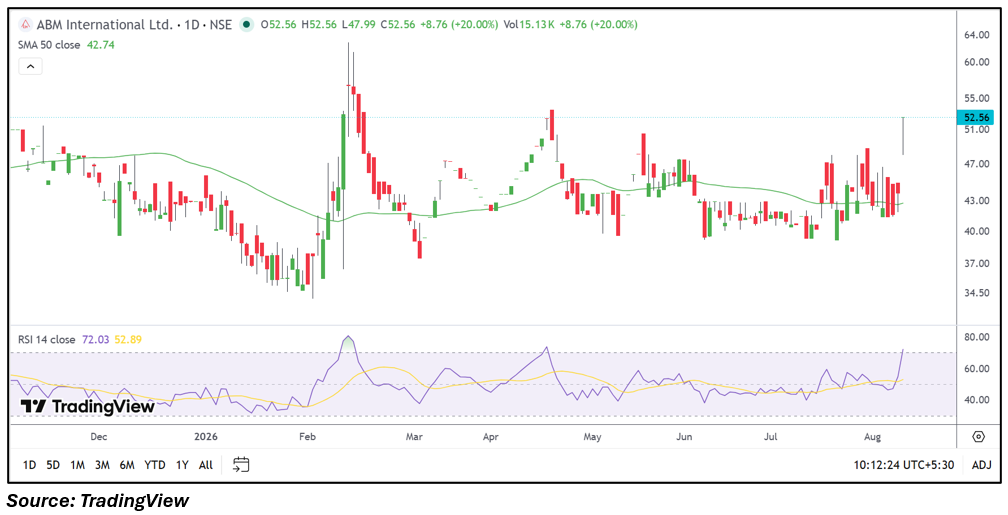
The daily chart shows a sharp upward move, with ABM International trading at ₹52.56 compared with its 50-day SMA of ₹42.74. The stock has therefore moved significantly above its medium-term moving average. RSI 14 stands at 72.03, above the conventional 70 threshold and indicating elevated momentum. The session opened at ₹52.56 and remained at that level as the day's high, while the low was ₹47.99. Volume was approximately 15.13 thousand shares and VWAP was ₹51.68. The chart therefore shows strong short-term price momentum, alongside an elevated RSI reading that warrants monitoring.
Key Technical Levels
Immediate support is around ₹47.99, based on the latest intraday low. The next support is near ₹43.80, corresponding to the previous close, while the 50-day SMA at ₹42.74 provides another important reference. Immediate resistance is around ₹52.56, which is the current session high and upper circuit level. As the stock is at the upper circuit, further price discovery would depend on subsequent trading sessions and changes in market participation.
Risks to Watch
- RSI above 70 indicates elevated short-term momentum.
- Sharp price movements can result in increased volatility.
- Relatively modest trading volume can contribute to wider price fluctuations.
- Future earnings may differ from the latest reported financial performance.
- A decline below recent support levels could change the current technical structure.
Summary
ABM International (NSE: ABMINTLLTD) jumped 20.00% to ₹52.56 on August 11, 2026, with the stock reaching its upper circuit level. The latest available March quarter results showed total income of ₹14.50 crore, profit before tax of ₹1.54 crore and net profit of ₹1.69 crore, with EPS at ₹1.91. Technically, the stock is well above its 50-day SMA of ₹42.74, while RSI at 72.03 indicates elevated momentum. Future monitoring will focus on earnings, trading activity, price behaviour around ₹52.56 and ₹47.99, and the stock's relationship with its medium-term moving average.
FAQs
Q: Why did ABM International jump 20.00% today?
A: ABM International rose 20.00% to ₹52.56, reaching the upper circuit during the August 11 trading session.
Q: What was ABM International's latest net profit?
A: The company reported consolidated net profit of ₹1.69 crore for the quarter ended March 31, 2026.
Q: What is ABM International's 50-day SMA?
A: The 50-day SMA stands at ₹42.74, below the current market price of ₹52.56.
Q: What does the RSI indicate for ABM International?
A: RSI 14 is at 72.03, indicating elevated momentum and a reading above the conventional 70 level.
Q: Which levels should investors monitor in ABM International?
A: The ₹47.99 level is an immediate downside reference, while ₹52.56 remains the key upside price level following the latest upper circuit move.