
Highlights
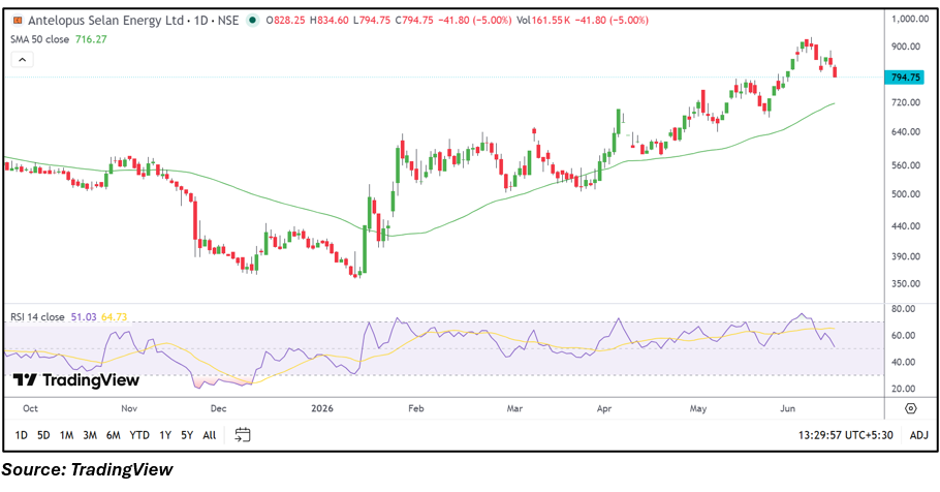
- Antelopus Selan Energy shares declined 5% and hit the lower circuit on June 15.
- The stock witnessed profit booking after a sharp multi-month rally.
- Despite the correction, the share price continues to trade above its 50-day SMA.
Overview
Antelopus Selan Energy (NSE: ANTELOPUS) came under selling pressure on June 15, 2026, with the stock falling 5.00% to ₹794.75 and locking into the lower circuit. The decline follows a strong rally over recent months that pushed the stock close to the ₹900 mark before profit booking emerged.
The stock opened at ₹828.25 and slipped steadily during the session, touching its day's low of ₹794.75. The correction comes after a period of significant outperformance, prompting traders to reassess near-term gains.
Fundamental View
For the quarter ended March 2026, Antelopus Selan Energy reported standalone total income of INR 10,374 lakh. Profit before tax stood at INR 5,049 lakh, while net profit came in at INR 3,808 lakh. Earnings per share for the quarter was reported at INR 10.83.
The latest financial performance reflects profitable operations. Investors are likely to continue monitoring crude oil prices, production volumes, exploration activity, and overall energy sector developments that could influence future earnings.
Technical View
Antelopus Selan Energy is currently trading at ₹794.75, down 5.00% for the session. Although the stock has witnessed a sharp correction from recent highs, it remains comfortably above its 50-day SMA of ₹716.27, indicating that the broader medium-term trend remains positive.
The chart shows a strong upward trajectory since early 2026, followed by a pullback over the last few sessions. The decline appears to be occurring after an extended rally, suggesting that traders may be booking profits rather than reacting to a major breakdown in the overall structure.
Momentum Indicator
The 14-day RSI stands near 51.03 after easing from higher levels. This indicates that momentum has cooled significantly from recent peaks and has moved closer to neutral territory.
Key Technical Levels
From the current price of ₹794.75, immediate support is seen around ₹755.00, followed by a stronger support zone near ₹715.00. On the upside, resistance may emerge near ₹835.00, while the next major hurdle is positioned around ₹875.00. The stock's behavior around these zones could provide clues about whether the recent decline remains a pullback or evolves into a broader correction.
Risks to Watch
- Profit booking after a sharp multi-month rally.
- Volatility linked to energy commodity prices.
- Exploration and production-related uncertainties.
- Sharp price swings following rapid advances.
Summary
Antelopus Selan Energy shares hit the lower circuit on June 15 as investors booked profits after a substantial rally in recent months. While the stock has weakened in the short term, it continues to trade above its 50-day SMA, suggesting that the broader trend remains constructive. Market participants will be watching whether the stock stabilizes near support levels or faces additional selling pressure in the coming sessions.
FAQs
- Why did Antelopus Selan Energy hit the lower circuit today?
The stock declined 5% amid profit booking after a strong rally over recent months.
- Is ANTELOPUS still trading above its 50-day SMA?
Yes, the stock remains above its 50-day SMA of ₹716.27 despite today's decline.
- Does today's fall indicate a trend reversal?
The broader trend remains positive, but traders will monitor whether support levels continue to hold.