

Highlights
- GNA Axles shares declined nearly 8% despite reporting higher Q1 FY27 earnings.
- Consolidated net profit rose to ₹3,827.12 lakh during the June 2026 quarter.
- Revenue increased to ₹47,175.52 lakh, reflecting healthy business momentum.
- The stock witnessed profit booking after a sharp rally in recent sessions.
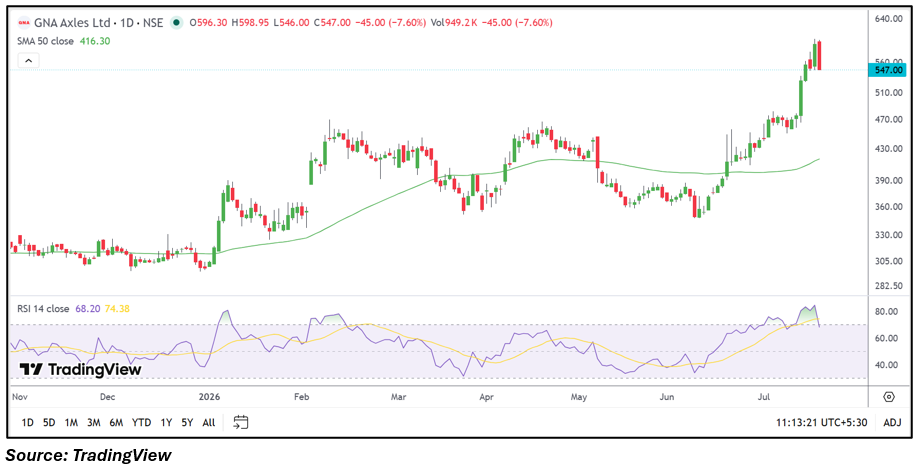
- Technically, the stock remains above its 50-day moving average despite Friday's correction.
- Investors may track management commentary, export demand, and margin trends in the coming quarters.
Overview
GNA Axles Limited (NSE: GNA), a leading manufacturer of rear axle shafts, spindles, and drivetrain components for commercial vehicles and off-highway equipment, came under selling pressure after announcing its Q1 FY27 financial results. Despite reporting year-opening earnings growth, the stock fell around 8% to ₹547.00, suggesting investors booked profits following a strong rally over recent sessions rather than reacting negatively to the company's operational performance.
Fundamental View
For the quarter ended June 2026, GNA Axles reported consolidated total income of ₹47,175.52 lakh. Profit before tax stood at ₹5,179.18 lakh, while net profit increased to ₹3,827.12 lakh. Earnings per share came in at ₹8.93. The quarterly performance reflected healthy operating momentum supported by demand from domestic and export markets. However, after a sharp appreciation in the share price over the past few weeks, the market appeared to focus on profit booking despite the improved financial performance. Going forward, export demand, raw material costs, capacity utilisation, and operating margins will remain key factors to monitor.
Technical View
Technically, GNA Axles continues to maintain a positive medium-term structure despite the sharp intraday correction. The stock is trading comfortably above its 50-day simple moving average of ₹416.30, indicating that the broader trend remains constructive. The 14-day RSI eased to around 68.20 after approaching overbought territory, reflecting moderation in momentum following the recent decline. The current pullback appears to be a retracement after a strong rally, and price action around key levels could determine the next directional move.
Key Technical Levels
Immediate support is placed near ₹533.00, followed by the next support around ₹519.00. On the upside, immediate resistance is seen near ₹561.00, while the next resistance is positioned around ₹575.00. Sustained movement beyond these levels may provide further confirmation of the stock's near-term trend.
Risks to Watch
- Slowdown in global automotive demand.
- Fluctuations in steel and raw material prices.
- Export market uncertainties.
- Margin pressure from input cost inflation.
- Currency fluctuations affecting overseas revenue.
Summary
GNA Axles reported a healthy start to FY27 with higher revenue and profit during the June quarter. However, the stock corrected sharply as investors appeared to lock in gains following its recent rally. While the broader technical trend remains positive with prices trading above the 50-day moving average, future earnings growth, export demand, and margin sustainability will be important factors influencing the stock's performance.
FAQs
Q: Why did GNA Axles shares fall after Q1 FY27 results?
A: Despite reporting higher profit, the stock witnessed profit booking after a strong rally ahead of the earnings announcement.
Q: How did GNA Axles perform in Q1 FY27?
A: The company reported consolidated total income of ₹47,175.52 lakh and net profit of ₹3,827.12 lakh, with EPS of ₹8.93.
Q: What does the current technical trend indicate?
A: The stock remains above its 50-day moving average, suggesting the broader medium-term trend is still constructive despite the recent correction.
Q: What are the key risks for GNA Axles?
A: Investors should monitor raw material costs, export demand, automotive industry trends, currency movements, and operating margins.
Q: What should investors watch going forward?
A: Future quarterly earnings, management guidance, export order momentum, margin performance, and technical price action will be key indicators to watch.