
Highlights
- SHAH declined more than 5% despite reporting a profitable March quarter.
- The stock slipped below its 50-day SMA, indicating weakening near-term momentum.
- RSI moved below the neutral zone, reflecting a softer technical structure.
Overview
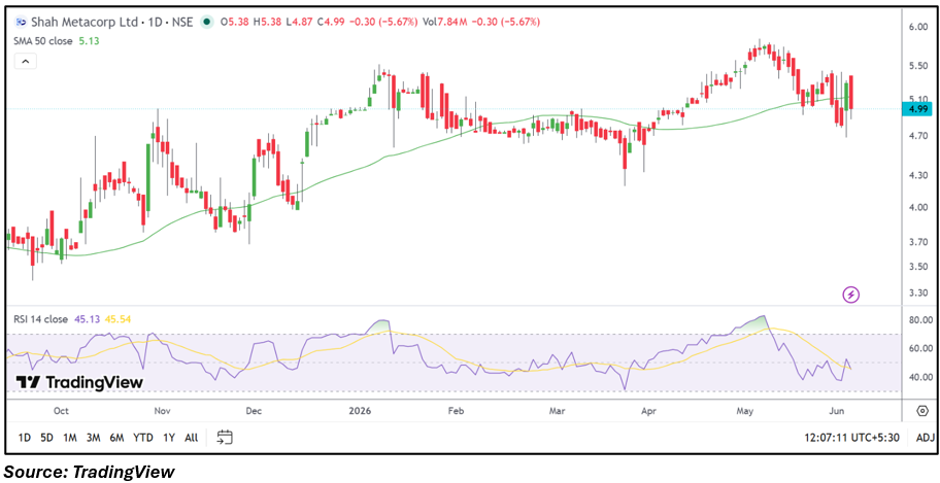
Shah Metacorp (NSE: SHAH) fell 5.67% to ₹4.99 on June 4, placing the stock among the session's notable losers. The decline came despite the company reporting positive earnings for the quarter ended March 2026. On the technical front, the stock faced selling pressure near recent highs and slipped below its 50-day moving average, suggesting traders may be locking in gains following the earlier rally.
Fundamental View
For the quarter ended March 2026, Shah Metacorp reported consolidated total income of INR 7,907.79 lakh. Profit before tax stood at INR 1,049.78 lakh, while net profit came in at INR 813.90 lakh. Earnings per share were reported at INR 0.09.
The latest results indicate that the company remained profitable during the quarter. However, the stock's recent decline suggests that market participants are currently focused on near-term price action rather than quarterly earnings.
Technical View
SHAH is currently trading at ₹4.99, slightly below its 50-day SMA of ₹5.13, reflecting a weaker near-term technical structure. Recent price action shows the stock retreating from its May highs and extending a short-term corrective phase.
The 14-day RSI stands at 45.13, below the neutral 50 mark, indicating fading momentum. The indicator suggests that bullish strength has moderated after the recent pullback.
Momentum Indicator
Momentum has weakened over the past few sessions, with RSI trending lower and remaining below its moving average. This reflects reduced upward participation and highlights the need for the stock to reclaim higher levels to improve sentiment.
Key Technical Levels
The immediate support level is placed near ₹4.74. If selling pressure persists, the next support zone is located around ₹4.49.
On the upside, the first resistance is seen near ₹5.24. A sustained move above this level could bring the next resistance area around ₹5.49 into focus.
Risks to Watch
- Sustained trading below the 50-day SMA.
- Weak momentum reflected by sub-50 RSI readings.
- Profit-booking pressure after the recent rally.
- Small-cap volatility may increase price swings.
Summary
Shah Metacorp emerged among the day's notable losers after declining more than 5%, despite reporting a profitable March quarter. Technically, the stock has slipped below its 50-day SMA while RSI remains below the neutral zone, indicating softer momentum. Support levels are placed near ₹4.74 and ₹4.49, while resistance is seen around ₹5.24 and ₹5.49. Traders will watch whether the stock can stabilize above key support zones in the coming sessions.
FAQs
Why did SHAH stock fall today?
The stock declined amid selling pressure and profit booking despite reporting positive quarterly earnings.
Is SHAH trading above its 50-day SMA?
No, the stock is currently trading slightly below its 50-day SMA of ₹5.13.
What levels should traders monitor?
Support is seen near ₹4.74 and ₹4.49, while resistance is located near ₹5.24 and ₹5.49.