
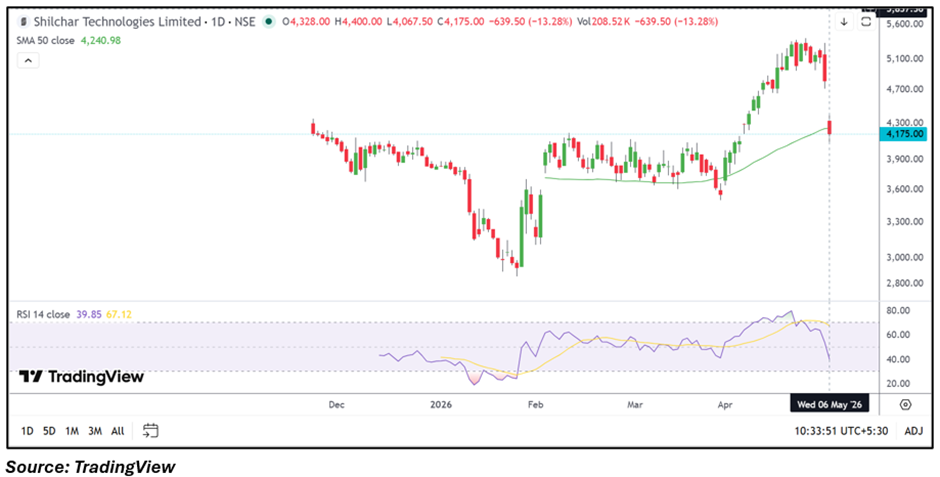
- Stock declines to ₹4,175.00, down 13.28% in the session
• Q4 net profit stood at ₹2,839.16 lakh despite sharp correction
• Profit booking emerges after strong multi-week rally
Overview
Shilchar Technologies Ltd (NSE: SHILCTECH) is trading near ₹4,175.00, falling 13.28% in the session despite reporting healthy FY26 earnings. The sharp decline comes after an extended rally in the stock over recent weeks, with investors appearing to lock in gains following the latest quarterly update.
The stock opened at ₹4,328.00 and touched an intraday low of ₹4,067.50 before attempting a mild recovery. The correction follows a strong upside move seen during April, when the stock climbed sharply and approached fresh highs near ₹5,000.00.
Market participants appear to be reacting more to valuation and profit-booking pressure rather than weakness in the company’s reported financial performance.
Fundamental View
For the quarter ended March 2026, Shilchar Technologies Ltd reported standalone total income of ₹15,831.65 lakh. Profit before tax stood at ₹3,747.61 lakh, while net profit came in at ₹2,839.16 lakh. Earnings per share for the quarter was reported at ₹24.82.
The latest numbers reflected continued profitability and operational strength. However, after the stock’s sharp rally in recent months, the market may have already priced in strong earnings expectations ahead of the results announcement.
Investors are also likely evaluating whether the pace of earnings growth can continue at current valuation levels, especially after the stock delivered significant gains over a short period.
Technical View
Technically, SHILCTECH has witnessed a sharp pullback after facing rejection near recent highs above ₹5,000.00. The stock has slipped below short-term momentum zones and is now trading close to its 50-day SMA near ₹4,240.98.
Price action indicates heightened volatility after the recent rally, with traders reducing exposure following the steep upside move seen earlier. The 14-day RSI has dropped sharply near 39.85, reflecting weakening short-term momentum after the correction.
Despite the sharp fall, the broader medium-term structure remains relatively stable as long as the stock holds above key support zones.
Key Technical Levels
Immediate support is placed around ₹3,900.00–₹3,700.00, which may act as an important demand zone on further weakness. On the upside, resistance is seen near ₹4,400.00–₹4,600.00, where selling pressure may emerge again.
Risks
- Sharp volatility following recent rally
• Profit booking after strong price appreciation
• Valuation concerns at higher levels
• Weak near-term momentum after breakdown from highs
Summary
Shilchar Technologies Ltd (NSE: SHILCTECH) corrected sharply despite posting healthy FY26 earnings, as investors appeared to book profits after the stock’s strong rally. While the company’s quarterly performance remained solid, the market reaction suggests expectations were already elevated heading into the results.
Going forward, traders are likely to monitor whether the stock stabilizes near key support levels or faces additional pressure amid broader volatility.
FAQs
Why did SHILCTECH share price fall today?
The decline appears linked to profit booking and valuation pressure after the stock’s sharp rally despite strong earnings.
What was Shilchar Technologies’ Q4 FY26 net profit?
The company reported net profit of ₹2,839.16 lakh for the March 2026 quarter.
What are the key levels to watch in SHILCTECH?
Support is placed near ₹3,900.00–₹3,700.00, while resistance is seen around ₹4,400.00–₹4,600.00.