

Highlights
- Sukhjit Starch & Chemicals shares declined more than 7% during Wednesday's session.
- The company reported a profitable consolidated performance for the June 2026 quarter.
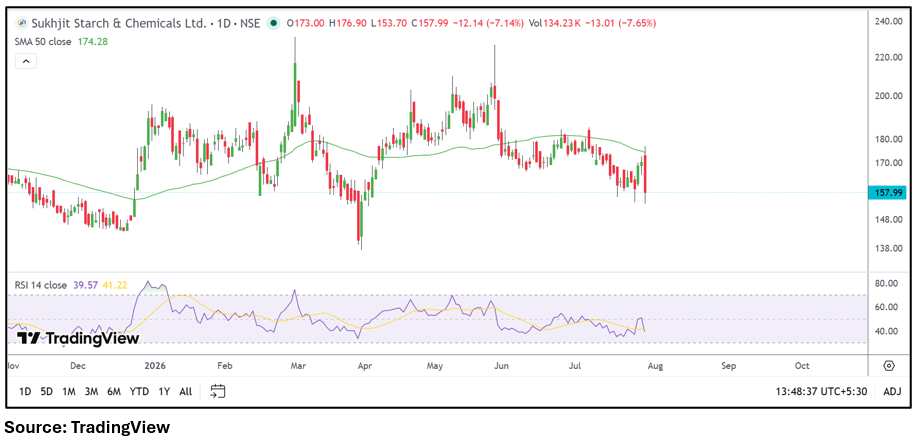
- The stock slipped below its 50-day moving average, weakening the near-term technical setup.
- Selling activity intensified following the quarterly earnings announcement.
- RSI remained below the neutral level, indicating subdued momentum.
- Investors will watch whether the stock stabilizes around recent support levels.
Overview
Sukhjit Starch & Chemicals Limited manufactures starch, glucose, dextrin, sorbitol and other specialty products catering to the food, pharmaceutical, paper, textile and industrial sectors. The company's shares declined over 7% to ₹157.17 during Wednesday's session even after announcing its June 2026 quarter results. The market reaction suggested a cautious sentiment, with the stock witnessing sharp intraday volatility following the earnings release.
Fundamental View
For the quarter ended June 2026, the company reported consolidated total income of ₹39,665.00 lakh. Profit before tax stood at ₹1,585.00 lakh, while net profit came in at ₹1,215.00 lakh. Earnings per share were ₹3.89. Although the company remained profitable, market participants are likely assessing the earnings performance alongside operating margins, demand conditions and the outlook for input costs across the starch and specialty chemicals business.
Technical View
The stock remained below its 50-day moving average of ₹174.28 after witnessing a sharp post-results decline. Selling activity accelerated during the session, dragging the price close to the day's low before a modest recovery. The 14-day RSI stood at 39.57, indicating weakening momentum and reflecting pressure on the near-term technical structure. The stock may require sustained strength above key resistance levels to improve the current trend.
Key Technical Levels
Immediate support is placed near ₹153.70, followed by the next support around ₹149.80. On the upside, immediate resistance is seen near ₹166.00, while the next important resistance is positioned around ₹174.30.
Risks to Watch
- Fluctuations in maize and other raw material prices.
- Pressure on operating margins.
- Demand slowdown across end-user industries.
- Competition in the starch and specialty chemicals segment.
- Broader market volatility.
Summary
Sukhjit Starch & Chemicals shares came under pressure despite reporting a profitable June 2026 quarter, reflecting a cautious market response to the earnings announcement. The stock has weakened technically after slipping below its 50-day moving average, while momentum indicators remain subdued. Investors will closely monitor future quarterly performance, margin trends and price action around key technical levels.
FAQs
Q: Why did Sukhjit Starch shares fall over 7% after Q1 FY27 results?
A: The stock witnessed a negative market reaction despite reporting a profitable quarter, with selling activity increasing after the earnings announcement.
Q: How did Sukhjit Starch perform in the June 2026 quarter?
A: The company reported consolidated total income of ₹39,665.00 lakh and a net profit of ₹1,215.00 lakh, with earnings per share of ₹3.89.
Q: What products does Sukhjit Starch & Chemicals manufacture?
A: The company manufactures starch, glucose, dextrin, sorbitol and other specialty products used across multiple industries.
Q: What is the current technical outlook for the stock?
A: The stock is trading below its 50-day moving average, while the RSI indicates subdued near-term momentum.
Q: What technical levels should investors monitor?
A: Immediate support is near ₹153.70, while resistance is placed around ₹166.00 and ₹174.30.