

Highlights
- Techno Electric shares declined 11.62% to ₹1,213.40 on Tuesday.
- March quarter net profit stood at ₹14,343.80 lakh with EPS at ₹12.33.
- Investors reacted despite the company reporting profitable quarterly performance.
Overview
Techno Electric & Engineering Company Limited (NSE: TECHNOE) came under pressure on May 26, 2026, with the stock falling 11.62% to ₹1,213.40 during the session. The decline followed the company’s latest quarterly earnings announcement, even as the reported numbers reflected profitability for the March 2026 quarter.
The company reported standalone total income of ₹1,09,597.00 lakh for the quarter ended March 2026. Profit before tax stood at ₹17,411.30 lakh, while net profit came at ₹14,343.80 lakh. Earnings per share (EPS) was reported at ₹12.33.
Fundamental View
Techno Electric & Engineering operates in the power infrastructure and engineering segment, where project execution, order inflows, and sector-level capital expenditure trends remain important for growth visibility.
Although the company reported profitable quarterly performance, the sharp price correction indicates investors may be reassessing valuations, earnings expectations, or broader market positioning following the recent rally in infrastructure-linked counters.
Technical View
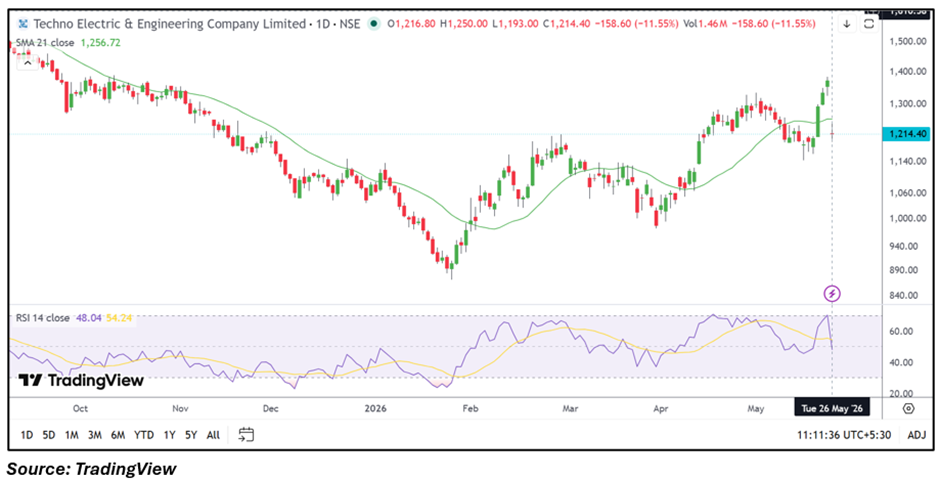
Techno Electric shares traded near ₹1,213.40 while remaining around the 21-day moving average near ₹1,256.72, reflecting weakening short-term momentum after recent volatility. The stock witnessed a sharp intraday decline after facing pressure near higher levels in previous sessions.
Immediate support is placed around ₹1,100.00–₹1,000.00, while resistance is seen near ₹1,340.00–₹1,500.00. Sustaining above the ₹1,100.00 zone could help stabilize near-term price action, while weakness below this range may keep pressure elevated.
Key Technical Levels
The immediate support zone is placed near ₹1,100.00–₹1,000.00, which may act as a key demand area during further weakness. On the upside, resistance is placed around ₹1,340.00–₹1,500.00. A recovery above the resistance range may improve broader sentiment in the counter.
Risks to Watch
- Sharp volatility after steep single-session decline.
- Weak infrastructure sector sentiment may affect recovery.
- Failure to hold above ₹1,100.00 could pressure structure.
- Broader market weakness may impact high-beta stocks.
Summary
Techno Electric & Engineering shares fell 11.62% to ₹1,213.40 after the latest quarterly earnings announcement. Despite reporting net profit of ₹14,343.80 lakh for the March 2026 quarter, the stock witnessed sharp selling pressure during the session. Traders may closely monitor whether the stock holds above the ₹1,100.00 support zone and whether stability returns near current levels.
FAQs
Why did Techno Electric shares decline sharply today?
The stock came under selling pressure after the latest quarterly earnings announcement despite profitable reported numbers.
What are the key support levels for Techno Electric stock?
Immediate support is placed around ₹1,100.00–₹1,000.00 based on the current price structure.
What resistance levels should investors watch in TECHNOE shares?
Resistance is seen near ₹1,340.00–₹1,500.00 during any recovery attempt.