
Highlights
- TECILCHEM declined more than 6% and emerged among the day's notable losers.
- The stock continues to trade below its 50-day SMA, reflecting a weak trend.
- Loss-making financial performance and weak momentum remain key concerns.
Overview
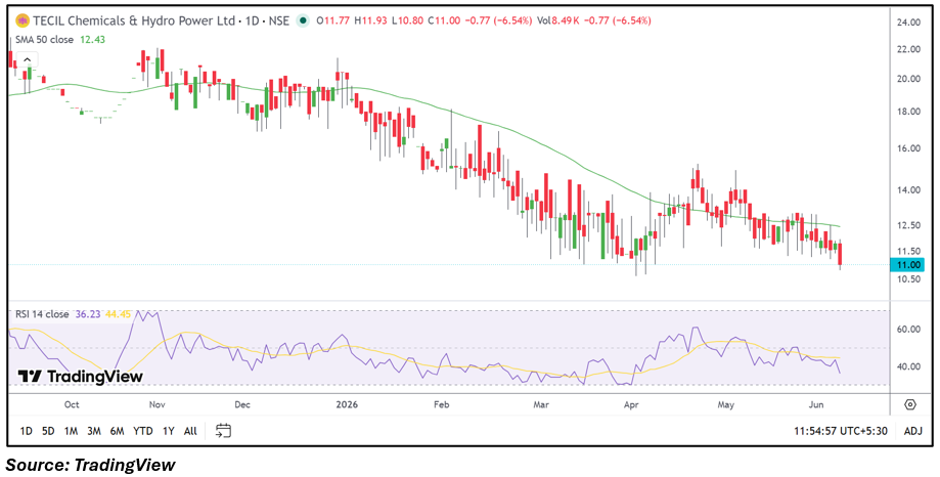
TECIL Chemicals and Hydro Power (NSE: TECILCHEM) fell 6.54% to ₹11.00 on June 8, 2026, extending its recent weakness and trading near fresh multi-month lows. The stock touched an intraday low of ₹10.80 while remaining below its 50-day Simple Moving Average (SMA) of ₹12.43. The continued decline highlights persistent selling pressure and a lack of sustained recovery momentum.
Fundamental View
TECIL Chemicals and Hydro Power reported weak financial performance for the quarter ended March 2026. The company posted total income of INR 0.01 lakh, while reporting a loss before tax of INR 16.46 lakh and a net loss of INR 16.46 lakh. Earnings per share stood at negative INR 0.09. The absence of meaningful revenue generation and continued losses remain key areas investors may monitor.
Technical View
TECILCHEM is trading at ₹11.00, below its 50-day SMA of ₹12.43, indicating that the broader near-term trend remains weak. Price action has been making lower highs and lower lows over recent months, reflecting continued downward pressure. The 14-day RSI stands at 36.23, remaining below the neutral 50 mark and suggesting subdued momentum. Unless the stock reclaims important overhead levels, the technical structure continues to favor consolidation to downside bias.
Momentum Indicator
The RSI reading of 36.23 indicates weak momentum and places the stock closer to oversold territory than to a recovery phase. A sustained improvement in RSI would be needed to signal any meaningful shift in trend.
Key Technical Levels
At the current market price of ₹11.00, immediate support is placed near ₹10.45, followed by a stronger support zone around ₹9.90. On the upside, resistance is seen near ₹11.55, while the next resistance level is positioned around ₹12.10. The stock may need to move above these resistance zones to improve its short-term outlook.
Risks to Watch
- Continued net losses may affect investor sentiment.
- Extremely low revenue generation remains a concern.
- ASM and GSM framework inclusion may increase volatility.
- Weak technical structure could invite further selling pressure.
Summary
TECIL Chemicals and Hydro Power remains under pressure as the stock trades near fresh lows while staying below its 50-day SMA. Weak quarterly financials, continued losses, and subdued momentum indicators have weighed on sentiment. Although the RSI is approaching oversold territory, the stock will need to stabilize above key support levels and reclaim resistance zones before any meaningful recovery can be confirmed.
FAQs
Why did TECILCHEM shares fall today?
The stock declined amid continued weak price action, persistent losses, and a technically weak structure below key averages.
What does the RSI indicate for TECILCHEM?
The RSI of 36.23 reflects weak momentum and suggests the stock remains under selling pressure.
What are the important levels to watch?
Support levels are ₹10.45 and ₹9.90, while resistance levels are ₹11.55 and ₹12.10.