

Highlights
- Modern Threads reported June 2026 quarter total income of ₹9,218.63 crore, with the latest results released on 14-Aug-2026.
- Profit Before Tax stood at ₹787.33 crore, while net profit reached ₹572.95 crore with EPS of ₹1.65.
- The stock was trading at ₹54.02, up ₹5.74 or 11.89% from the previous close of ₹48.28.
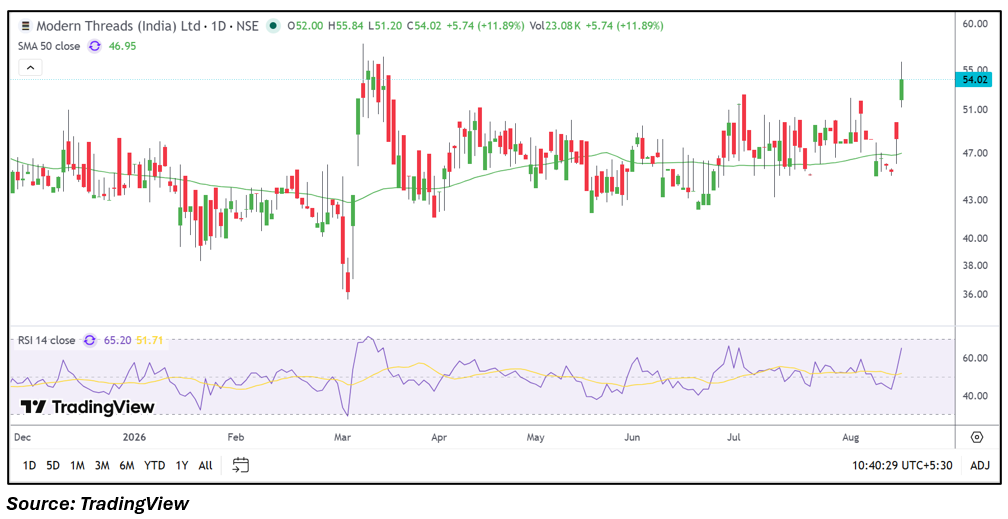
- The stock is trading above its 50-day SMA of ₹46.95, while RSI at 65.20 indicates elevated momentum.
- Trading activity showed volume of 23.08K shares, with the stock moving between ₹51.20 and ₹55.84 during the session.
- Investors should monitor whether the recent earnings-led move sustains above the ₹51.20-₹48.28 zone and how momentum develops near recent highs.
Overview
Modern Threads (India) Limited (NSE: MODTHREAD) is engaged in the textile and related manufacturing business, and its shares were trading at ₹54.02 on 17-Aug-2026, compared with the previous close of ₹48.28. The stock opened at ₹52.00, touched a high of ₹55.84 and a low of ₹51.20, while VWAP stood at ₹53.72. The latest movement follows the company's June 2026 quarter results announced on 14-Aug-2026, which showed total income of ₹9,218.63 crore and net profit of ₹572.95 crore. The stock's latest price action indicates a positive market response to the financial update, although the broader trading structure remains important for assessing whether the move can sustain.
Fundamental View
For the quarter ended 30-Jun-2026, Modern Threads reported total income of ₹9,218.63 crore, Profit Before Tax of ₹787.33 crore and net profit of ₹572.95 crore, with EPS at ₹1.65. Based on the reported figures, the PBT margin was approximately 8.54%, while the net profit margin was approximately 6.22%. The results provide a basis for monitoring revenue consistency, profitability, operating efficiency and earnings per share in subsequent quarters. Future financial updates will also be important for assessing whether the latest performance represents sustained improvement or a quarter-specific change in business conditions.
Technical View
The daily chart shows the stock at ₹54.02, above its 50-day SMA of ₹46.95, indicating that the current price structure remains above the medium-term average. The stock has recently moved from the ₹47.00-₹49.00 area toward ₹54.02, with the session high at ₹55.84. RSI 14 is at 65.20, reflecting elevated momentum but remaining below the conventional 70 level. Volume was 23.08K shares, while the latest candles show a sharp upward move from the recent consolidation zone. The technical structure therefore reflects improving momentum following the earnings update, with the ₹55.84 area becoming an important near-term reference.
Key Technical Levels
Immediate support is around ₹51.20, corresponding to the current session low and the lower portion of the latest upward move. Next support is around ₹48.28, which was the previous close, followed by the 50-day SMA near ₹46.95. Immediate resistance is around ₹55.84, the latest session high. Next resistance is near ₹60.00, where the chart shows the next visible psychological price zone.
Risks to Watch
- Sustained trading below ₹51.20 could weaken the latest short-term price structure.
- RSI at 65.20 leaves limited distance before entering the traditionally overbought zone.
- The stock's recent rise may face volatility if earnings expectations change.
- Future quarters will need to maintain profitability to support the current financial narrative.
- Lower trading activity or a decline in volume could reduce the strength of the recent price move.
Summary
Modern Threads (India) Limited (NSE: MODTHREAD) has recorded total income of ₹9,218.63 crore and net profit of ₹572.95 crore for the June 2026 quarter, while its stock has moved above the 50-day SMA and reached ₹54.02 after the latest results. The technical structure shows improving momentum, with RSI at 65.20 and ₹55.84 representing the latest visible high. Going forward, investors can monitor subsequent earnings, profitability trends, trading volumes and the stock's ability to sustain its position around the identified support and resistance levels.
FAQs
Q: Why has Modern Threads (NSE: MODTHREAD) stock moved higher?
A: The recent move followed the company's June 2026 quarter results, which reported total income of ₹9,218.63 crore and net profit of ₹572.95 crore.
Q: What was Modern Threads' net profit in Q1 FY27?
A: Modern Threads reported net profit of ₹572.95 crore for the quarter ended 30-Jun-2026.
Q: What is Modern Threads' 50-day SMA?
A: The 50-day SMA shown on the daily chart is ₹46.95.
Q: What is the RSI of Modern Threads stock?
A: The RSI 14 reading shown on the chart is 65.20, indicating elevated momentum.
Q: What technical levels should investors monitor for Modern Threads?
A: The ₹51.20 and ₹48.28 zones are notable support areas, while ₹55.84 and ₹60.00 are visible resistance references.