

Highlights
- Ahluwalia Contracts is trading below its 50-day SMA after a sharp decline on August 18, 2026.
- June 2026 standalone total income stood at ₹114,154.15 lakh, while net profit was ₹1,141.81 lakh.
- The stock opened at ₹776.00, touched ₹782.40 and fell to ₹714.90.
- The 50-day SMA is positioned at ₹830.73, above the current trading level.
- Volume stood at 368.80 thousand shares during the session, indicating increased activity.
- Investors should monitor support levels, RSI, trading volumes, the moving average and future financial performance.
Overview
Ahluwalia Contracts (India) Limited (NSE: AHLUCONT) is an engineering and construction company engaged in infrastructure, commercial, institutional and building projects. On August 18, 2026, the stock was trading at ₹719.20, down 9.40% from the previous close of ₹793.85. It opened at ₹776.00, reached a high of ₹782.40 and declined to a low of ₹714.90, while VWAP stood at ₹731.31. The latest session has marked a significant shift in the recent price structure after the stock had been trading largely around the ₹800.00-₹860.00 zone. The decline has also taken the stock below its 50-day SMA, while the broader market reaction reflects increased volatility in the counter. Trading activity and subsequent price behaviour will be important for determining whether the latest weakness persists.
Fundamental View
For the quarter ended June 30, 2026, Ahluwalia Contracts reported standalone total income of ₹114,154.15 lakh, profit before tax of ₹1,534.58 lakh and net profit of ₹1,141.81 lakh. Earnings per share stood at ₹1.70. The quarterly numbers provide a base for assessing the company's revenue execution and profitability across its construction activities. Future performance will depend on project execution, order inflows, operating margins, working capital management and infrastructure spending. Investors will also monitor subsequent quarterly revenue, profit, margins, cash flows and order-book developments to assess the company's operating trajectory.
Technical View
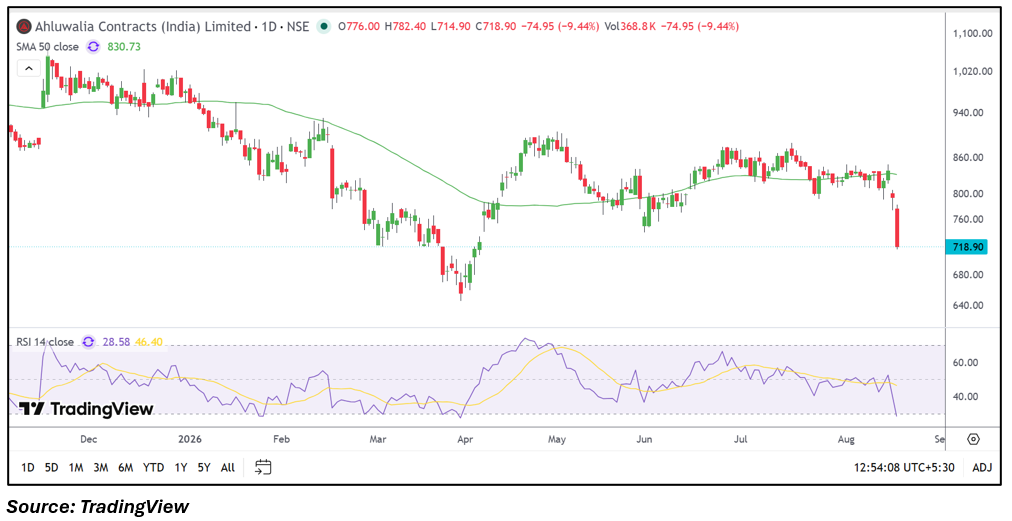
The daily chart shows a sharp deterioration in the recent price structure, with the stock falling from the ₹800.00 region and ending close to the lower portion of the day's range. The 50-day SMA stands at ₹830.73, leaving the current price below this medium-term reference. RSI 14 has declined to 28.58, reflecting significantly weaker momentum and an oversold reading on the displayed timeframe. Volume has reached 368.80 thousand shares, highlighting increased activity during the decline. The latest candle spans from ₹782.40 to ₹714.90, showing substantial intraday volatility. Further movement around the recent low, RSI and 50-day SMA will help determine the evolving technical structure.
Key Technical Levels
Support is visible around ₹683.24, followed by ₹647.28. Resistance can be observed around ₹755.16, followed by ₹791.12. The 50-day SMA at ₹830.73 remains another important reference level for the medium-term price structure. Price behaviour around these levels, together with changes in volume and momentum, will help in assessing the stock's evolving chart pattern.
Risks to Watch
- Continued weakness below recent trading lows could increase short-term volatility.
- RSI remaining at depressed levels may reflect persistent momentum deterioration.
- Elevated trading activity during declining sessions could result in wider price movements.
- Sustained trading below the 50-day SMA could weaken the medium-term technical structure.
- Project execution, order inflows, margins and working capital remain important fundamental variables.
Summary
Ahluwalia Contracts is currently trading below its 50-day SMA following a sharp decline during the August 18, 2026, session. The stock was at ₹719.20 after touching a low of ₹714.90, while RSI stood at 28.58 and trading volume reached 368.80 thousand shares. The June 2026 quarter reported standalone total income of ₹114,154.15 lakh and net profit of ₹1,141.81 lakh, with EPS of ₹1.70. The current technical structure reflects weaker short-term momentum, while the 50-day SMA at ₹830.73 remains above the market price. Going forward, support and resistance zones, volume behaviour, RSI, the moving average and subsequent financial and business developments will remain important areas to monitor.
FAQs
Q: Why is Ahluwalia Contracts trading below its key moving average?
A: The stock has declined sharply during the latest session, moving below its 50-day SMA of ₹830.73 and weakening its recent technical structure.
Q: What is Ahluwalia Contracts' 50-day SMA?
A: The 50-day SMA shown on the daily chart is ₹830.73.
Q: What was Ahluwalia Contracts' net profit in June 2026?
A: The company reported standalone net profit of ₹1,141.81 lakh for the quarter ended June 30, 2026.
Q: What is the current RSI of Ahluwalia Contracts?
A: The 14-day RSI shown on the chart is 28.58.
Q: Which technical levels should be monitored for AHLUCONT?
A: Support can be monitored around ₹683.24 and ₹647.28, while resistance can be observed around ₹755.16 and ₹791.12.