

Highlights
- ATLANTAA shares declined 8.33% to ₹38.62 on August 13, 2026.
- Q1 FY27 consolidated total income stood at ₹2,223.43 crore, while net loss was ₹506.39 crore.
- The stock opened at ₹40.06, touched a high of ₹40.92 and declined to ₹38.36.
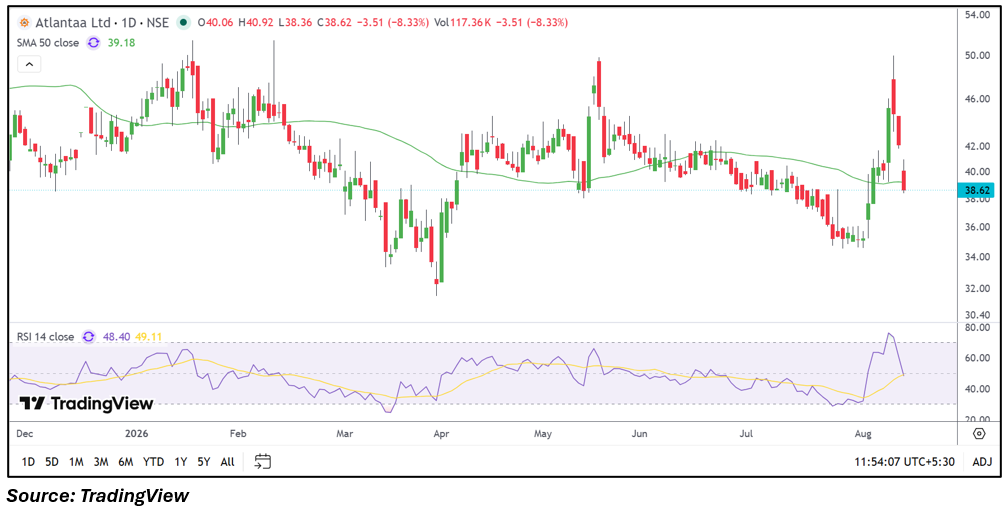
- The share price is trading below its 50-day SMA of ₹39.18 after the latest decline.
- Trading volume stood at approximately 117.36 thousand shares, with the stock under ASM-1 surveillance.
- Investors will monitor quarterly losses, business execution, volumes and price movement around key technical levels.
Overview
ATLANTAA Limited (NSE: ATLANTAA) operates in the infrastructure and related business space. The stock declined 8.33% to ₹38.62 on August 13, 2026, compared with the previous close of ₹42.13. It opened at ₹40.06, reached a high of ₹40.92 and touched a low of ₹38.36, while VWAP stood at ₹39.46. The decline followed the company's June 2026 quarter financial disclosure, which showed a consolidated loss for the period. The stock also remained under ASM-1 surveillance. The broader market reaction reflected continued attention on the company's latest financial performance and short-term price structure.
Fundamental View
For the quarter ended June 30, 2026, ATLANTAA reported consolidated total income of ₹2,223.43 crore. Profit before tax stood at a loss of ₹539.72 crore, while net loss was ₹506.39 crore. EPS was negative at ₹0.62. The reported figures indicate pressure on profitability despite the level of quarterly income. The latest results make revenue quality, cost management, project execution and the path toward improved profitability important areas for monitoring. Future quarters will also provide additional information on operating performance and the company's ability to manage its financial position.
Technical View
The daily chart shows the stock declining from the recent August recovery zone toward ₹38.62. The current price is below the 50-day SMA of ₹39.18, indicating that the latest session has weakened the near-term price structure relative to this moving-average reference. RSI 14 stands at 48.40, down sharply from the elevated readings seen earlier in August. Volume was approximately 117.36 thousand shares. The chart also shows a sharp reversal after the recent upward move, with the latest candle returning the price close to the ₹38.00 area.
Key Technical Levels
Immediate support is around ₹38.36, based on the latest session low. Next support is near ₹36.00, which corresponds with the recent August trading structure. Immediate resistance is around ₹39.18, aligned with the 50-day SMA. Next resistance is near ₹40.92, corresponding to the latest session high.
Risks to Watch
- Continued quarterly losses could affect the company's financial performance.
- A sustained move below ₹38.36 could weaken the recent price structure further.
- Elevated volatility may continue following the sharp August price swings.
- Project execution and cost management remain important for future profitability.
- ASM-1 surveillance status may remain relevant to trading activity.
Summary
ATLANTAA reported consolidated total income of ₹2,223.43 crore and a net loss of ₹506.39 crore for Q1 FY27, with EPS at negative ₹0.62. Following the results, the stock declined 8.33% to ₹38.62 on August 13, trading below its 50-day SMA of ₹39.18. RSI at 48.40 and the recent reversal from higher August levels point to a notable change in short-term momentum. Future monitoring will focus on profitability, project execution, financial performance, trading volumes and price behaviour around ₹38.36, ₹39.18 and ₹40.92.
FAQs
Q: What was ATLANTAA's Q1 FY27 net profit?
A: ATLANTAA reported a consolidated net loss of ₹506.39 crore for the quarter ended June 30, 2026.
Q: What was ATLANTAA's Q1 FY27 total income?
A: Consolidated total income stood at ₹2,223.43 crore during the June 2026 quarter.
Q: Why is ATLANTAA stock under pressure?
A: The stock declined 8.33% following the latest quarterly results, which showed a substantial consolidated loss.
Q: What is ATLANTAA's 50-day SMA?
A: The 50-day SMA shown on the chart is ₹39.18, compared with the latest price of ₹38.62.
Q: What should investors monitor?
A: Investors should monitor quarterly profitability, project execution, trading volumes and price movement around ₹38.36, ₹39.18 and ₹40.92.