
Highlights
- Blue Jet Healthcare shares surged over 9% and featured among the day's top gainers.
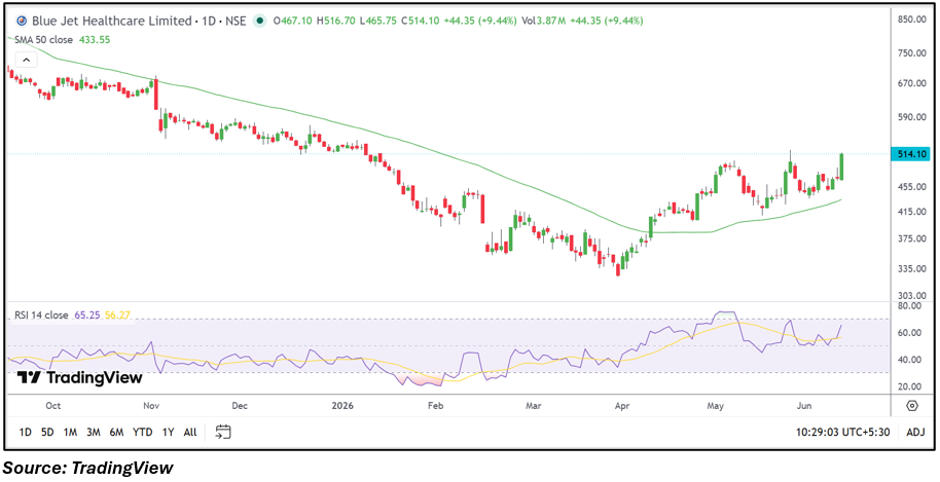
- The stock trades above its 50-day SMA, reflecting a positive medium-term trend.
- RSI remains above 65, indicating improving momentum despite recent volatility.
Overview
Blue Jet Healthcare (NSE: BLUEJET) gained nearly 9.43% on June 11, with the stock rising to ₹514.05 after touching an intraday high of ₹516.70. The rally came on strong trading volumes of around 3.87 million shares, making the stock one of the most actively watched counters in the healthcare and specialty chemicals space. The move extends the stock's recovery from its March lows and highlights renewed investor interest.
Fundamental View
Blue Jet Healthcare reported standalone total income of ₹25,758.80 lakh for the quarter ended March 2026. Profit before tax stood at ₹8,714.90 lakh, while net profit came in at ₹6,434.40 lakh. Earnings per share were reported at ₹3.71. The company's profitability and earnings profile continue to remain key factors supporting market sentiment.
Technical View
Blue Jet Healthcare is trading at ₹514.05, well above its 50-day SMA of ₹433.55, indicating that the medium-term trend remains positive. The stock has been forming a sequence of higher highs and higher lows since its March bottom and recently moved above the ₹500 mark. Price action suggests sustained strength following a period of consolidation.
Momentum Indicator
The 14-day RSI is currently around 65.25, remaining above the neutral 50 mark. This indicates improving momentum while still staying below the extreme overbought zone, suggesting that bullish sentiment remains intact.
Key Technical Levels
Blue Jet Healthcare has immediate support near ₹485.00, while the next important support zone is placed around ₹455.00. On the upside, resistance is seen near ₹520.00, and a sustained move above this level could bring the ₹550.00 region into focus.
Key Risks to Watch
- Volatility may increase after the recent sharp rally.
- Profit booking could emerge near resistance zones.
- Sector-wide sentiment shifts may impact momentum.
- High valuation expectations may influence trading activity.
Summary
Blue Jet Healthcare emerged among the top gainers after advancing more than 9% on strong volumes. The stock remains comfortably above its 50-day SMA and continues to display a constructive price structure. While momentum indicators remain supportive, investors may watch whether the stock can sustain gains above the ₹500 level and build on its recent breakout.
FAQs
Why did Blue Jet Healthcare shares rise today?
The stock gained over 9% amid strong trading activity and continued positive price momentum.
What is the current technical trend for BLUEJET?
The stock is trading above its 50-day SMA and maintains a positive medium-term structure.
What should investors monitor going forward?
Investors may track volume trends, price action near resistance levels, and any signs of profit booking.