
Highlights
- Creative Newtech shares were locked in a 20% upper circuit at ₹756.75.
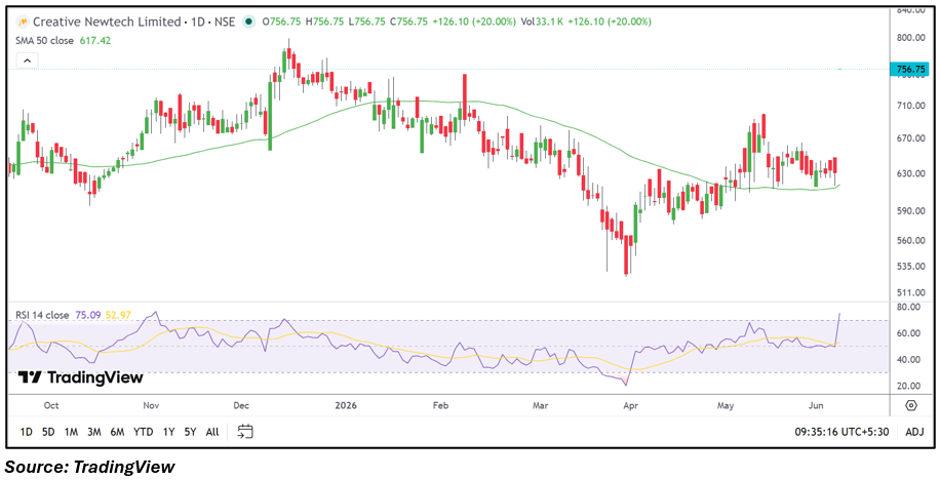
- The stock moved decisively above its 50-day SMA of ₹617.42.
- RSI surged above 75.00, reflecting strong short-term momentum.
Overview
Creative Newtech Limited (NSE: CNL) emerged among the top gainers on June 8 after the stock hit its 20% upper circuit limit at ₹756.75. The sharp move followed a prolonged consolidation phase on the daily chart and pushed the stock to its highest level in several months. The stock opened at the upper circuit price and remained locked there throughout the session, highlighting strong demand.
Fundamental View
For the quarter ended March 2026, the company reported total income of INR 71,835.63 lakh. Profit before tax stood at INR 1,633.23 lakh, while net profit came in at INR 1,240.04 lakh. Earnings per share for the quarter were INR 8.26. The latest results indicate that the company remained profitable during the reported period.
Technical View
Creative Newtech has delivered a decisive breakout on the daily timeframe after spending several weeks consolidating near the ₹610.00–₹650.00 range. The stock is now trading comfortably above its 50-day SMA of ₹617.42, indicating an improvement in the broader technical structure.
The breakout candle and upper-circuit move suggest a sharp expansion in momentum. Price action has also moved above recent swing highs, placing the stock in a fresh upward leg. While the overall setup has strengthened, traders may monitor whether the stock can sustain above the breakout zone after the sharp one-day advance.
Momentum Indicator
The 14-day RSI has climbed to 75.09, moving into overbought territory. This reflects strong momentum, although elevated RSI readings can sometimes be followed by short periods of consolidation after a rapid rally.
Key Technical Levels
Based on the current market price of ₹756.75, the first support is placed near ₹718.91, while the next support is seen around ₹681.08. On the upside, immediate resistance is positioned near ₹794.59, followed by the next resistance around ₹832.43. Holding above the first support zone could help maintain the current positive structure, while sustained trading above the first resistance may open the door for further upside.
Risks to Watch
- Overbought RSI conditions may trigger profit-booking.
- Failure to hold breakout levels could weaken momentum.
- Low trading participation may increase volatility.
- Sharp one-day rallies can lead to consolidation phases.
Summary
Creative Newtech shares surged to a 20% upper circuit after breaking out from a prolonged consolidation range on the daily chart. The stock is trading above its 50-day SMA of ₹617.42, while the RSI at 75.09 reflects strong momentum. Although the technical setup has improved significantly, investors may watch whether the stock can sustain above key breakout levels following the sharp advance.
FAQs
- Why did Creative Newtech shares hit the upper circuit today?
The stock witnessed a strong breakout from consolidation, resulting in a sharp rally and upper circuit move.
- Is CNL trading above its key moving average?
Yes, the stock is trading comfortably above its 50-day SMA of ₹617.42.
- What are the key levels to watch now?
Support is near ₹718.91 and ₹681.08, while resistance is around ₹794.59 and ₹832.43.