

Highlights
- DJ Mediaprint & Logistics reported consolidated total income of ₹3,648.78 lakh for the June quarter.
- Profit before tax stood at ₹277.04 lakh, while net profit reached ₹218.51 lakh.
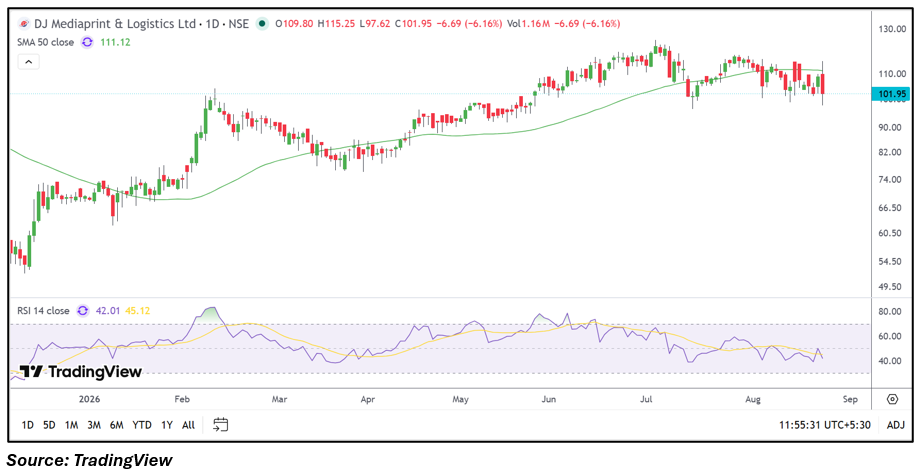
- The stock opened at ₹109.80 and moved to a session high of ₹115.25 before declining toward ₹101.95.
- The share is trading below its 50-day SMA of ₹111.12, keeping the short-term structure under observation.
- Trading volume was around 1.16 million shares, while VWAP stood at ₹107.33.
- Investors should monitor earnings growth, margins, volumes, RSI and the recent trading range for further changes.
Overview
DJ Mediaprint & Logistics Limited (NSE: DJML) provides printing, logistics, document management and related business services. The stock opened at ₹109.80, touched a high of ₹115.25 and a low of ₹97.62 before trading around ₹101.95, compared with the previous close of ₹108.64. The stock’s movement came amid active trading, with volume of around 1.16 million shares and VWAP at ₹107.33. The daily chart shows that the share has moved sideways after reaching higher levels earlier in the year, while the latest decline has taken the price below the 50-day moving average. The market reaction remains focused on quarterly performance, price structure and trading activity.
Fundamental View
For the quarter ended June 2026, DJ Mediaprint & Logistics reported consolidated total income of ₹3,648.78 lakh, profit before tax of ₹277.04 lakh and net profit of ₹218.51 lakh. EPS stood at ₹0.64. The quarterly numbers provide a basis for tracking revenue generation, profitability and operating efficiency across the company’s printing, logistics and document-related businesses. Margins remain an important factor as investors assess whether earnings can remain sustainable across upcoming quarters. Future financial updates will be useful for evaluating business momentum, cost management, order activity and the company’s ability to maintain profitability.
Technical View
The daily chart shows a weakening short-term structure after the stock recently traded near higher levels. The 50-day SMA is positioned at ₹111.12, while the current price remains below this reference level. RSI 14 is around 42.01, indicating that momentum has moderated following the recent decline. The stock moved through a wide intraday range between ₹97.62 and ₹115.25, reflecting elevated price volatility. Volume near 1.16 million shares indicates active participation during the session. The chart currently shows the price testing lower levels after moving below its recent trading zone, while the relationship between price and the 50-day SMA remains important for assessing the next phase of the technical structure.
Key Technical Levels
A key support area is visible around ₹97.60, close to the latest session low, followed by the ₹90.00 region where earlier price activity was concentrated. On the upside, ₹108.60 is a notable reference based on the previous close, while ₹115.25 marks the latest session high. These levels provide reference points for tracking whether the stock establishes a recovery structure or continues to trade at lower levels.
Risks to Watch
- Quarterly earnings could remain sensitive to changes in operating costs and business volumes.
- Sustained trading below the 50-day SMA could keep the technical structure under observation.
- Elevated price volatility may result in sharp changes in the daily trading range.
- Lower profitability in future quarters could affect the fundamental outlook.
- Changes in logistics demand, competition and execution could influence future business performance.
Summary
DJ Mediaprint & Logistics Limited (NSE: DJML) remains engaged in printing, logistics and document-related services, with the latest quarter reporting total income of ₹3,648.78 lakh and net profit of ₹218.51 lakh. The technical structure has weakened as the stock trades below its 50-day SMA of ₹111.12, while RSI at 42.01 reflects moderated momentum. The latest session also recorded active trading and a broad price range. Going forward, investors should monitor quarterly earnings, margins, business execution, volumes and the ₹97.60-₹115.25 trading range for changes in the stock’s market structure.
FAQs
Q: What is the latest share price of DJ Mediaprint & Logistics?
A: DJ Mediaprint & Logistics was trading around ₹101.95 during the latest session provided.
Q: What were DJ Mediaprint & Logistics’ June quarter results?
A: Consolidated total income was ₹3,648.78 lakh, profit before tax was ₹277.04 lakh and net profit was ₹218.51 lakh.
Q: What is the 50-day SMA of DJ Mediaprint & Logistics?
A: The 50-day SMA shown on the chart is ₹111.12.
Q: What is the RSI of DJ Mediaprint & Logistics stock?
A: The RSI 14 reading shown on the chart is 42.01.
Q: What should investors monitor in DJ Mediaprint & Logistics?
A: Investors should monitor quarterly earnings, margins, business execution, trading volumes, the 50-day SMA and the recent ₹97.60-₹115.25 price range.