

Highlights
- Goodluck India Limited (NSE: GOODLUCK) declined 8.35% to ₹1,356.10 during the August 11 session.
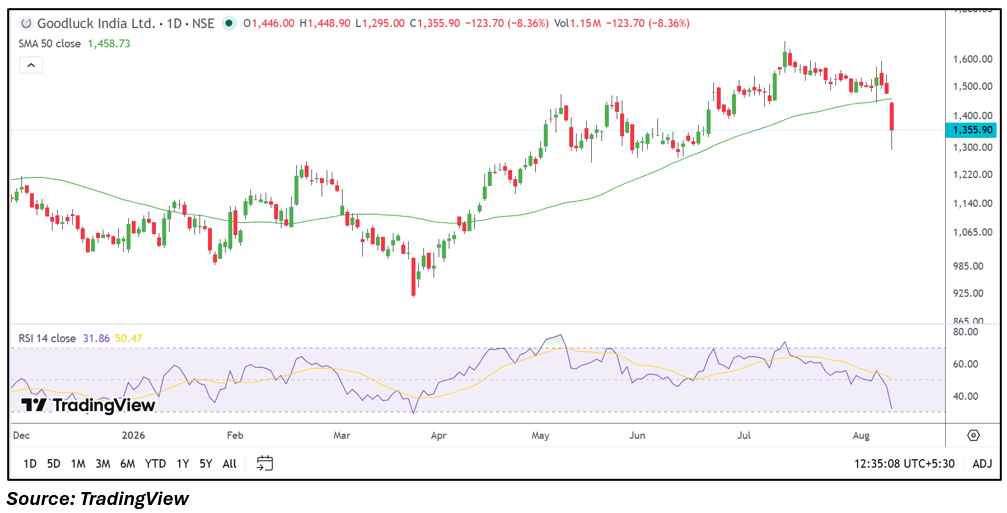
- The stock opened at ₹1,446.00, touched a high of ₹1,448.90 and fell to an intraday low of ₹1,295.00.
- June quarter consolidated total income stood at ₹1,29,221.79 lakh, while net profit was ₹6,721.62 lakh.
- The stock moved below its 50-day SMA of ₹1,458.73 during the sharp decline.
- Trading volume stood at approximately 1.15 million shares, with VWAP at ₹1,346.34.
- Investors should monitor the ₹1,295.00 low, the 50-day SMA, RSI and upcoming financial performance.
Overview
Goodluck India Limited (NSE: GOODLUCK) operates in the steel and engineering products industry, with its businesses serving infrastructure, automotive, power and other industrial applications. The stock declined 8.35% to ₹1,356.10 on August 11, 2026, compared with the previous close of ₹1,479.60. It opened at ₹1,446.00, moved to a high of ₹1,448.90 and declined to ₹1,295.00 before recovering from the day's low. VWAP stood at ₹1,346.34, while trading volume was approximately 1.15 million shares. The decline followed a period of strength during July and early August, when the stock had traded around the ₹1,500-₹1,600 region. The latest market reaction has therefore brought the company's recent financial performance and the changing technical structure into focus.
Fundamental View
For the quarter ended June 30, 2026, Goodluck India reported consolidated total income of ₹1,29,221.79 lakh, profit before tax of ₹8,830.53 lakh and net profit of ₹6,721.62 lakh. Earnings per share stood at ₹19.13. The latest results indicate a profitable operating period and provide an important reference point for evaluating the company's earnings trajectory. Future performance will depend on factors including steel demand, product realisations, raw-material costs, capacity utilisation and operating margins. Infrastructure investment, industrial activity and automotive demand could also influence order flows. Upcoming quarterly results will be important for monitoring revenue growth, margins, profitability, EPS and cash-flow trends.
Technical View
The daily chart shows that Goodluck India had maintained a broader upward price structure from the April low before entering a consolidation phase around the ₹1,500 level. The latest session has changed the short-term structure, with the stock falling below its 50-day SMA of ₹1,458.73. RSI 14 has declined to 31.86 after remaining considerably higher during the preceding weeks, reflecting the deterioration in short-term momentum. The session also recorded a wide range between ₹1,295.00 and ₹1,448.90, while volume remained elevated at approximately 1.15 million shares. The price closed at ₹1,356.10, below the moving average, making subsequent sessions relevant for assessing whether the stock establishes support or continues to weaken.
Key Technical Levels
Immediate support is around ₹1,295.00, corresponding to the latest intraday low. The next support zone is near ₹1,250.00, followed by the ₹1,220.00 area visible on the broader chart. Immediate resistance is around ₹1,458.73, corresponding to the 50-day SMA. The next resistance is near ₹1,500.00, followed by the ₹1,550.00-₹1,600.00 zone where the stock previously traded.
Risks to Watch
- A sustained move below the 50-day SMA could keep the short-term price structure under pressure.
- RSI at 31.86 reflects a substantial deterioration in recent momentum.
- The wide intraday range indicates elevated volatility in the stock.
- Steel prices, raw-material costs and product realisations can affect operating margins.
- Future quarterly results will determine whether recent earnings performance remains consistent.
Summary
Goodluck India (NSE: GOODLUCK) declined 8.35% to ₹1,356.10 despite reporting a profitable June quarter, with consolidated total income of ₹1,29,221.79 lakh and net profit of ₹6,721.62 lakh. EPS stood at ₹19.13. The latest price action has pushed the stock below its 50-day SMA of ₹1,458.73, while RSI has fallen to 31.86, highlighting weaker short-term momentum. The stock's next price structure, trading volumes, ₹1,295.00 low and upcoming financial results will remain important areas for monitoring as the market evaluates the latest reversal.
FAQs
Q: Why did Goodluck India shares decline despite strong June quarter numbers?
A: The stock declined 8.35% during the August 11 session after trading at higher levels in the preceding weeks. The latest price action reflects a sharp change in short-term market structure despite the reported quarterly profitability.
Q: What were Goodluck India's June quarter results?
A: Consolidated total income was ₹1,29,221.79 lakh, profit before tax was ₹8,830.53 lakh and net profit was ₹6,721.62 lakh. EPS stood at ₹19.13.
Q: What is Goodluck India's 50-day SMA?
A: The 50-day SMA is ₹1,458.73, while the latest market price is ₹1,356.10.
Q: What is the latest RSI reading for Goodluck India?
A: RSI 14 is 31.86, showing that short-term momentum has weakened considerably during the latest decline.
Q: Which levels should be monitored on the Goodluck India chart?
A: ₹1,295.00 is the immediate support reference, while ₹1,458.73 is the 50-day SMA and the first major resistance reference.