
Highlights
- MTAR Technologies shares declined more than 8% after a sharp rally.
- The stock remains above its 50-day SMA despite the latest correction.
- Profit booking emerged as momentum indicators cooled from elevated levels.
Overview
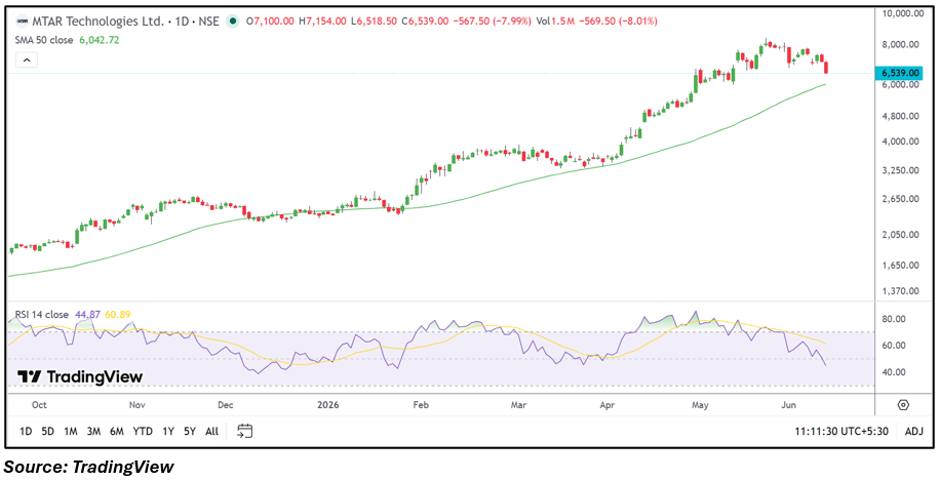
MTAR Technologies Limited (NSE: MTARTECH) was among the notable losers on June 11, with the stock falling 8.15% to ₹6,527.50. The decline comes after an extended rally that pushed the stock to fresh highs in recent weeks. Despite the sharp pullback, the broader trend remains constructive as the stock continues to trade above key medium-term averages and retains a significant portion of its recent gains.
Fundamental View
For the quarter ended March 2026, MTAR Technologies reported consolidated total income of ₹32,246.40 lakh. Profit before tax stood at ₹5,954.20 lakh, while net profit came in at ₹4,428.30 lakh. Earnings per share were reported at ₹14.40.
The latest results reflect continued profitability and healthy earnings generation. However, after a substantial run-up in the share price, market participants appear to be reassessing valuations and locking in gains.
Technical View
MTAR Technologies is currently trading at ₹6,527.50, down 8.15% for the session, while remaining above its 50-day SMA of ₹6,042.64. The stock had been in a strong upward trend before encountering selling pressure near recent highs. The latest decline indicates a pause in momentum, with price action moving away from peak levels after an extended advance.
Momentum Indicator
The 14-day RSI stands at 44.83, down sharply from higher readings seen during the rally. The decline in RSI suggests momentum has cooled considerably, although it has not yet entered oversold territory.
Key Technical Levels
MTAR Technologies has immediate support around ₹6,500.00, followed by a stronger support zone near ₹6,000.00. On the upside, resistance is visible around ₹7,150.00, while a sustained recovery could bring the ₹7,800.00 region back into focus.
Risks to Watch
- Profit booking after a prolonged rally.
- Elevated valuation with PE above 50.
- Volatility following sharp price swings.
- Failure to hold near-term support levels.
Summary
MTAR Technologies has emerged among today's top losers as investors booked profits after a powerful multi-month rally. While the stock remains above its 50-day SMA and the company continues to report profitable operations, momentum has weakened in the near term. Investors may watch whether the stock stabilizes near current levels or extends its correction toward lower support zones.
FAQs
- Why did MTAR Technologies shares fall today?
The stock witnessed profit booking after a strong rally, leading to a decline of more than 8%. - Is MTAR Technologies still profitable?
Yes. The company reported a consolidated net profit of ₹4,428.30 lakh in the March 2026 quarter. - What is the key technical level to watch?
Investors may watch the ₹6,500.00 support zone and the ₹7,150.00 resistance area.