

Highlights
- NELCO is witnessing a sharp decline during the August 18, 2026 trading session.
- June 2026 consolidated total income stood at ₹8,017.00 lakh, with net profit of ₹234.00 lakh.
- The stock opened at ₹1,092.30 and declined to a session low of ₹956.00.
- Price remains above the 50-day SMA of ₹905.93 despite the latest decline.
- Trading activity has increased, with volume at 1.52 million shares during the session.
- Investors should monitor the recent low, RSI, trading volumes, moving average and upcoming financial developments.
Overview
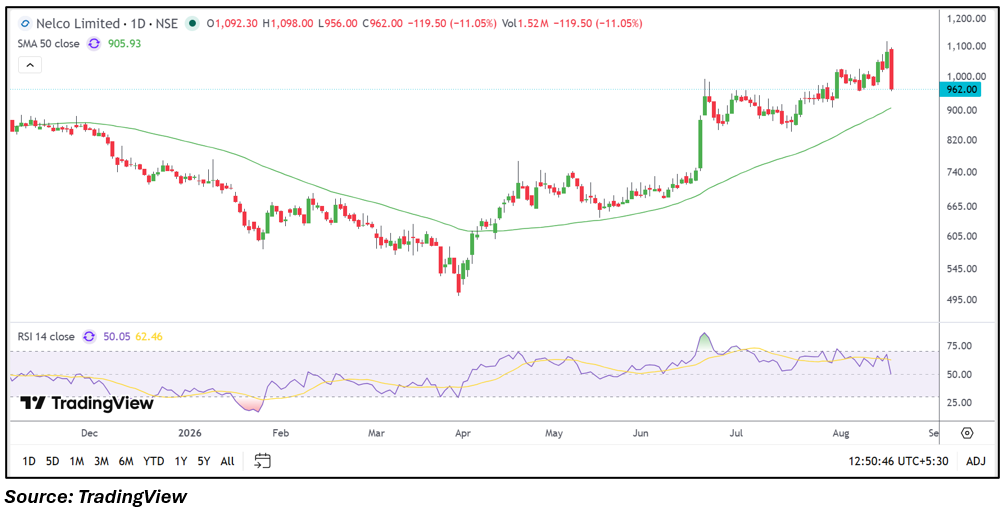
NELCO Limited (NSE: NELCO) operates in the satellite communication and related technology services segment, providing connectivity and communication solutions for enterprise and institutional applications. On August 18, 2026, the stock was trading at ₹962.00, down 11.05% from the previous close of ₹1,081.50. It opened at ₹1,092.30, touched a high of ₹1,098.00 and slipped to a low of ₹956.00, while VWAP stood at ₹981.32. The sharp decline follows a strong upward movement visible on the daily chart, with the stock recently trading above the ₹1,000.00 level. The latest session has weakened the short-term price structure, although the stock remains above its 50-day SMA. Market reaction is therefore focused on whether the recent decline develops into a broader correction or stabilises around lower support zones.
Fundamental View
For the quarter ended June 30, 2026, NELCO reported consolidated total income of ₹8,017.00 lakh, profit before tax of ₹313.00 lakh and net profit of ₹234.00 lakh. Earnings per share stood at ₹1.02. The reported figures indicate continued profitability, while future performance will depend on revenue growth, satellite communication demand, operating costs, project execution and margins. The company operates in a sector where connectivity requirements, technology investments and institutional demand can influence business performance. Investors will continue to monitor subsequent quarterly revenue, profit, margins, cash flows and business developments for evidence of sustained operating momentum.
Technical View
The daily chart shows a sharp decline from the recent upper trading zone around ₹1,050.00-₹1,100.00. The stock is currently at ₹962.00, which remains above the 50-day SMA of ₹905.93, keeping the broader medium-term structure above its moving-average reference. RSI 14 has declined to 50.05 from higher levels seen during the recent advance, indicating a notable loss of short-term momentum without reaching an oversold reading. Volume has reached 1.52 million shares, highlighting increased trading activity during the decline. The latest candle also shows a wide session range between ₹1,098.00 and ₹956.00, making subsequent price and volume behaviour important for assessing the developing structure.
Key Technical Levels
Support is visible around ₹956.00, followed by ₹905.93 near the 50-day SMA. Resistance can be observed around ₹1,000.00, followed by ₹1,081.50 near the previous close. These levels provide reference points for tracking whether the stock stabilises after the recent decline or continues to move within a wider corrective structure.
Risks to Watch
- Sustained weakness below recent support could increase short-term volatility.
- A continued decline in RSI could indicate further loss of momentum.
- Higher volumes during falling sessions may increase price fluctuations.
- Trading below recent swing levels could alter the current medium-term structure.
- Changes in revenue growth, margins, project execution and sector demand could affect future financial performance.
Summary
NELCO is currently experiencing a sharp technical decline after a strong advance toward recent highs. The stock traded at ₹962.00 on August 18, 2026, with a session low of ₹956.00, while RSI at 50.05 reflects a significant moderation in momentum. The broader chart structure remains above the 50-day SMA of ₹905.93. Fundamentally, the June 2026 quarter reported consolidated total income of ₹8,017.00 lakh and net profit of ₹234.00 lakh, with EPS of ₹1.02. Going forward, price behaviour around ₹956.00 and ₹905.93, trading volumes, RSI, resistance levels and subsequent financial performance will remain important areas to monitor.
FAQs
Q: Why is NELCO witnessing a sharp decline?
A: The stock has recorded a significant one-session decline after recently trading near higher levels, resulting in a weaker short-term price structure and lower momentum.
Q: What is NELCO's 50-day SMA?
A: NELCO's 50-day SMA on the daily chart is ₹905.93.
Q: What was NELCO's net profit in June 2026?
A: NELCO reported consolidated net profit of ₹234.00 lakh for the quarter ended June 30, 2026.
Q: What is NELCO's current RSI?
A: The 14-day RSI shown on the chart is 50.05.
Q: Which technical levels should be monitored for NELCO?
A: Support can be monitored around ₹956.00 and ₹905.93, while resistance can be observed around ₹1,000.00 and ₹1,081.50.