

Highlights
- Shekhawati Industries Limited (NSE: SHEKHAWATI) rose 19.97% to ₹16.52 on August 11, 2026.
- The stock opened at ₹13.69 and touched a high of ₹16.52, against a low of ₹13.23.
- The March quarter recorded total income of ₹900.36 lakh and net profit of ₹463.24 lakh.
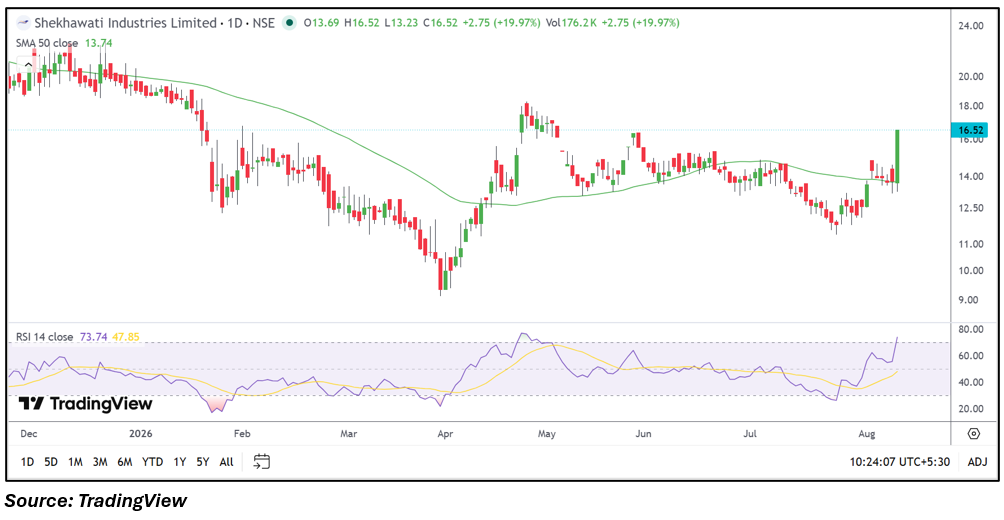
- The share price moved above its 50-day SMA of ₹13.74 during the session.
- RSI 14 climbed to 73.74, reflecting elevated short-term momentum.
- Investors should monitor the ₹16.52 price level, volumes, subsequent earnings and business performance.
Overview
Shekhawati Industries Limited (NSE: SHEKHAWATI) is engaged in textile yarn manufacturing along with real estate-related activities. The stock jumped 19.97% to ₹16.52 on August 11, 2026, compared with the previous close of ₹13.77. It opened at ₹13.69, touched a high of ₹16.52 and recorded a low of ₹13.23. VWAP stood at ₹15.81, while trading volume was around 176.20 thousand shares. The sharp move comes after a prolonged period of weak and range-bound price action, with the stock having spent much of the recent period below the ₹15.00 mark. The latest session therefore represents a notable change in the short-term price structure.
Fundamental View
For the quarter ended March 31, 2026, Shekhawati Industries reported standalone total income of ₹900.36 lakh, profit before tax of ₹463.24 lakh and net profit of ₹463.24 lakh. Earnings per share stood at ₹1.34. The March quarter numbers provide the latest available financial reference for the company, with profitability remaining an important factor for assessing its operating performance. Going forward, investors will be watching revenue growth, margins, cash flows and earnings consistency, along with developments in the company's textile operations and real estate activities. Future quarterly results will provide a clearer indication of whether the reported profitability can be maintained.
Technical View
The daily chart shows a sharp upward move after several weeks of consolidation between roughly ₹13.00 and ₹15.00. The stock moved decisively above its 50-day SMA of ₹13.74 and reached ₹16.52 during the session. RSI 14 has risen to 73.74, moving above the conventional 70 threshold and indicating elevated momentum. The price structure has therefore changed significantly from the recent sideways phase, although the rapid rise has also increased short-term volatility. Trading activity stood at approximately 176.20 thousand shares, while the stock remained close to its session high, making subsequent volume and price behaviour important for assessing whether the latest move is sustained.
Key Technical Levels
Immediate support is around ₹13.74, corresponding to the 50-day SMA. The next support is near ₹13.23, the day's low. Immediate resistance is at ₹16.52, which is also the latest intraday high. The next visible resistance zone is around ₹18.00, based on the earlier price structure visible on the daily chart. These levels provide references for tracking the stock's price behaviour after the sharp August 11 move.
Risks to Watch
- Elevated RSI at 73.74 indicates stretched short-term momentum.
- The stock has moved sharply from its recent consolidation range.
- Relatively modest trading volume can contribute to higher price volatility.
- Textile margins can be affected by raw-material costs and demand conditions.
- Future results will determine whether recent profitability remains consistent.
Summary
Shekhawati Industries (NSE: SHEKHAWATI) recorded a sharp 19.97% rise to ₹16.52 on August 11, marking a significant move after months of weaker and range-bound trading. The company reported March quarter total income of ₹900.36 lakh, profit before tax of ₹463.24 lakh, net profit of ₹463.24 lakh and EPS of ₹1.34. Technically, the stock moved above its 50-day SMA of ₹13.74, while RSI reached 73.74. Future monitoring will centre on price behaviour around ₹16.52 and ₹13.74, trading activity, upcoming financial results and developments across its operating businesses.
FAQs
Q: Why did Shekhawati Industries rise 19.97%?
A: The stock advanced 19.97% during the August 11 session, moving from ₹13.77 to ₹16.52 amid a sharp change in its recent price structure.
Q: What was Shekhawati Industries' latest reported profit?
A: The company reported a standalone net profit of ₹463.24 lakh for the quarter ended March 31, 2026.
Q: What is Shekhawati Industries' 50-day SMA?
A: The 50-day SMA is ₹13.74, and the stock moved above this level during the latest session.
Q: What is the current RSI of Shekhawati Industries?
A: RSI 14 is at 73.74, indicating elevated short-term momentum.
Q: What are the key price levels for Shekhawati Industries?
A: ₹16.52 is the immediate resistance reference, while ₹13.74 and ₹13.23 are nearby support levels.