

Highlights
- Sumeet Industries shares fell 4.99% during the session with limited trading activity.
- The company reported net profit of ₹750.39 lakh for March 2026.
- Sumeet Industries operates in the textile manufacturing segment.
Sumeet Industries Stock Movement in Focus
Sumeet Industries Limited (NSE: SUMEETINDS) featured among the top losers during the trading session, with its shares declining 4.99%.
The stock opened at ₹33.54 and remained at the same level during the session. It recorded an intraday high and low of ₹33.54 each, compared with the previous close of ₹35.30. The latest traded price stood at ₹33.54.
The stock witnessed trading volume of 47,379 shares, while the traded value stood at ₹15.89 lakh during the session.
Overview
Sumeet Industries Limited operates in the textile sector and is involved in manufacturing activities related to synthetic yarn products.
The company’s operations are linked with textile industry demand, raw material prices, production costs, and broader market conditions affecting the sector.
Sumeet Industries has reported both consolidated and standalone audited financial results for the period ended March 2026.
Fundamental View
According to the provided financial data, Sumeet Industries reported total income of ₹26,698.10 lakh for the audited consolidated period ended March 2026.
During the same period, profit before tax stood at ₹513.13 lakh, while net profit was reported at ₹750.39 lakh. Earnings per share stood at ₹0.15.
The company’s audited standalone financial results for March 2026 reported the same figures, with total income of ₹26,698.10 lakh, profit before tax of ₹513.13 lakh, net profit of ₹750.39 lakh, and EPS of ₹0.15.
The identical standalone and consolidated figures indicate that the reported financial data provided for the period remained the same across both reporting formats.
Technical Summary
Sumeet Industries has extended its upward momentum with consecutive higher highs and higher lows, supported by a steady increase in trading volumes, reflecting sustained market participation. The stock is approaching resistance near ₹35–36, while immediate support is placed around ₹31.50. Holding above support could keep the near-term technical structure favourable.
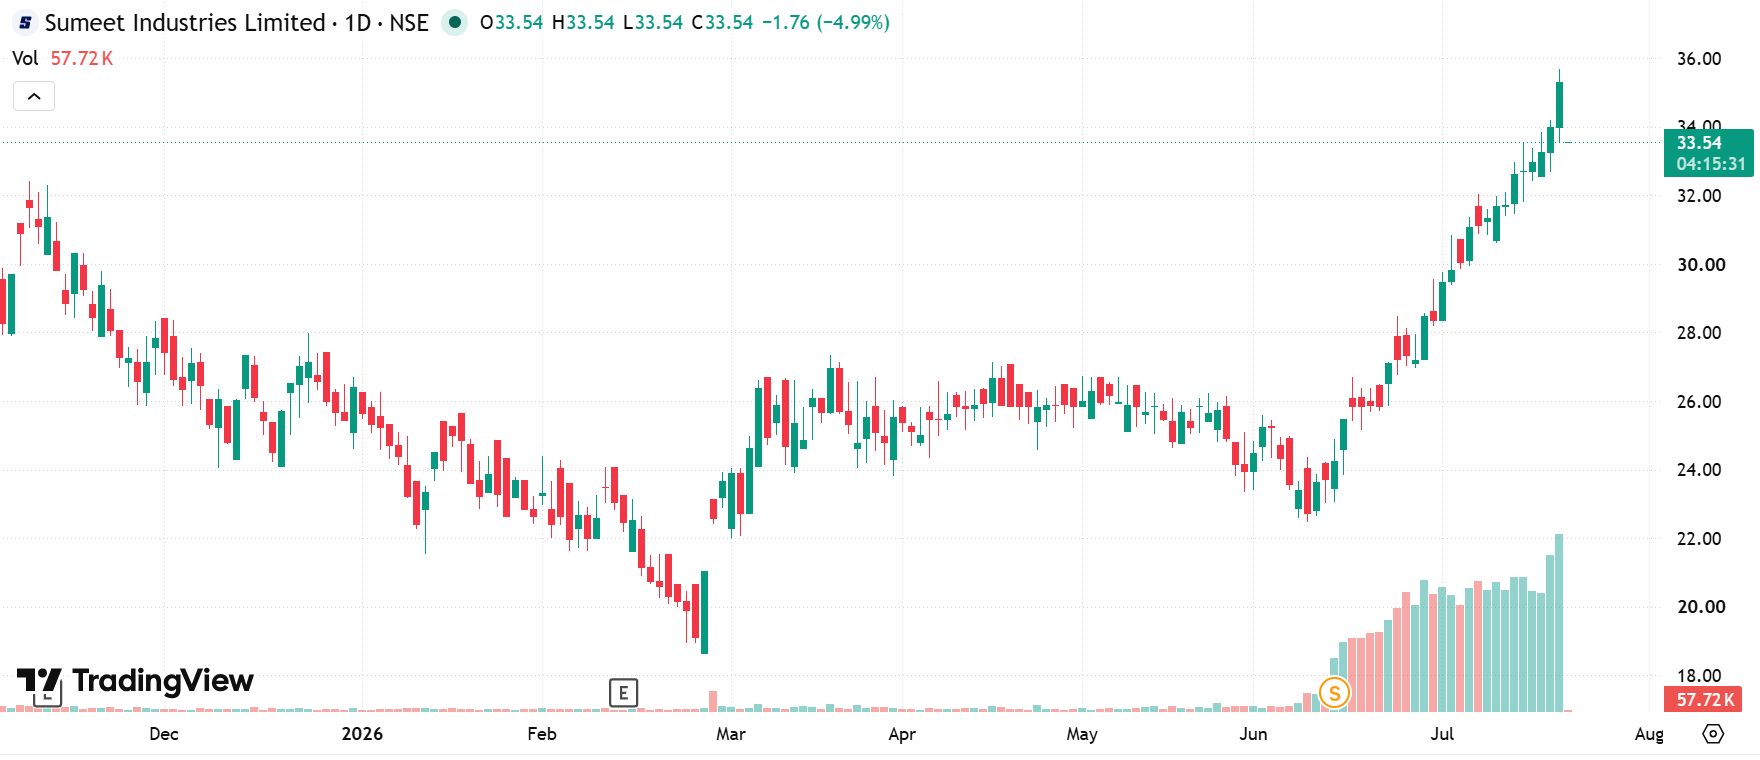
Chart By TradingView
Key Risks
- Textile demand fluctuations may affect revenue visibility and operations.
- Raw material price changes can influence manufacturing costs.
- Industry competition may impact business performance.
- Market liquidity may affect short-term price movement.
Summary
Sumeet Industries declined 4.99% during the trading session, emerging among the top losers. The company reported total income of ₹26,698.10 lakh and net profit of ₹750.39 lakh for the audited March 2026 period. The textile company’s stock movement occurred alongside available financial updates and sector-related factors.
FAQs
Q: Why is Sumeet Industries in focus today?
A: Sumeet Industries declined 4.99% during trading, placing the stock among the session’s notable losers.
Q: What was Sumeet Industries’ net profit in March 2026?
A: The company reported net profit of ₹750.39 lakh for the audited March 2026 period.
Q: Which sector does Sumeet Industries operate in?
A: Sumeet Industries operates in the textile sector and is involved in manufacturing activities.