

Highlights
- Tarsons Products shares gained 12.85% during the session with increased trading activity.
- The company reported consolidated net profit of ₹418.10 lakh for March 2026.
- Tarsons Products operates in laboratory and healthcare plasticware manufacturing.
Tarsons Products Stock Movement in Focus
Tarsons Products Limited (NSE: TARSONS) emerged among the top gainers during the trading session, with its shares rising 12.85%.
The stock opened at ₹294.95 and touched an intraday high of ₹322.50. It recorded a low of ₹292.10 compared with the previous close of ₹281.35. The latest traded price stood at ₹317.50.
The stock witnessed trading volume of 7,11,132 shares, while the traded value stood at ₹2,237.22 lakh during the session.
Overview
Tarsons Products Limited operates in the manufacturing of laboratory plasticware and related products used across healthcare, research, and scientific applications.
The company’s product portfolio includes consumables used in laboratories and research facilities. Its business performance is influenced by demand from healthcare, diagnostics, pharmaceutical, biotechnology, and research segments.
Tarsons Products has reported consolidated financial results, reflecting the combined performance of the company and its related entities.
Fundamental View
According to the provided financial data, Tarsons Products reported consolidated total income of ₹12,753.70 lakh for the audited period ended March 2026.
During the same period, profit before tax stood at ₹576.90 lakh, while consolidated net profit was reported at ₹418.10 lakh. Earnings per share stood at ₹0.79.
The company’s reported financial performance reflects its operational results for the audited consolidated period. Market participants generally track revenue, profitability, and earnings trends to understand business performance over different reporting periods.
Technical Summary
Tarsons Products has recorded a strong upward move following a breakout from its recent trading range, supported by a notable increase in trading volumes, indicating improved market participation. The stock is approaching resistance near ₹330–335, while immediate support is placed around ₹295. Sustained buying interest above current levels could strengthen the near-term technical outlook.
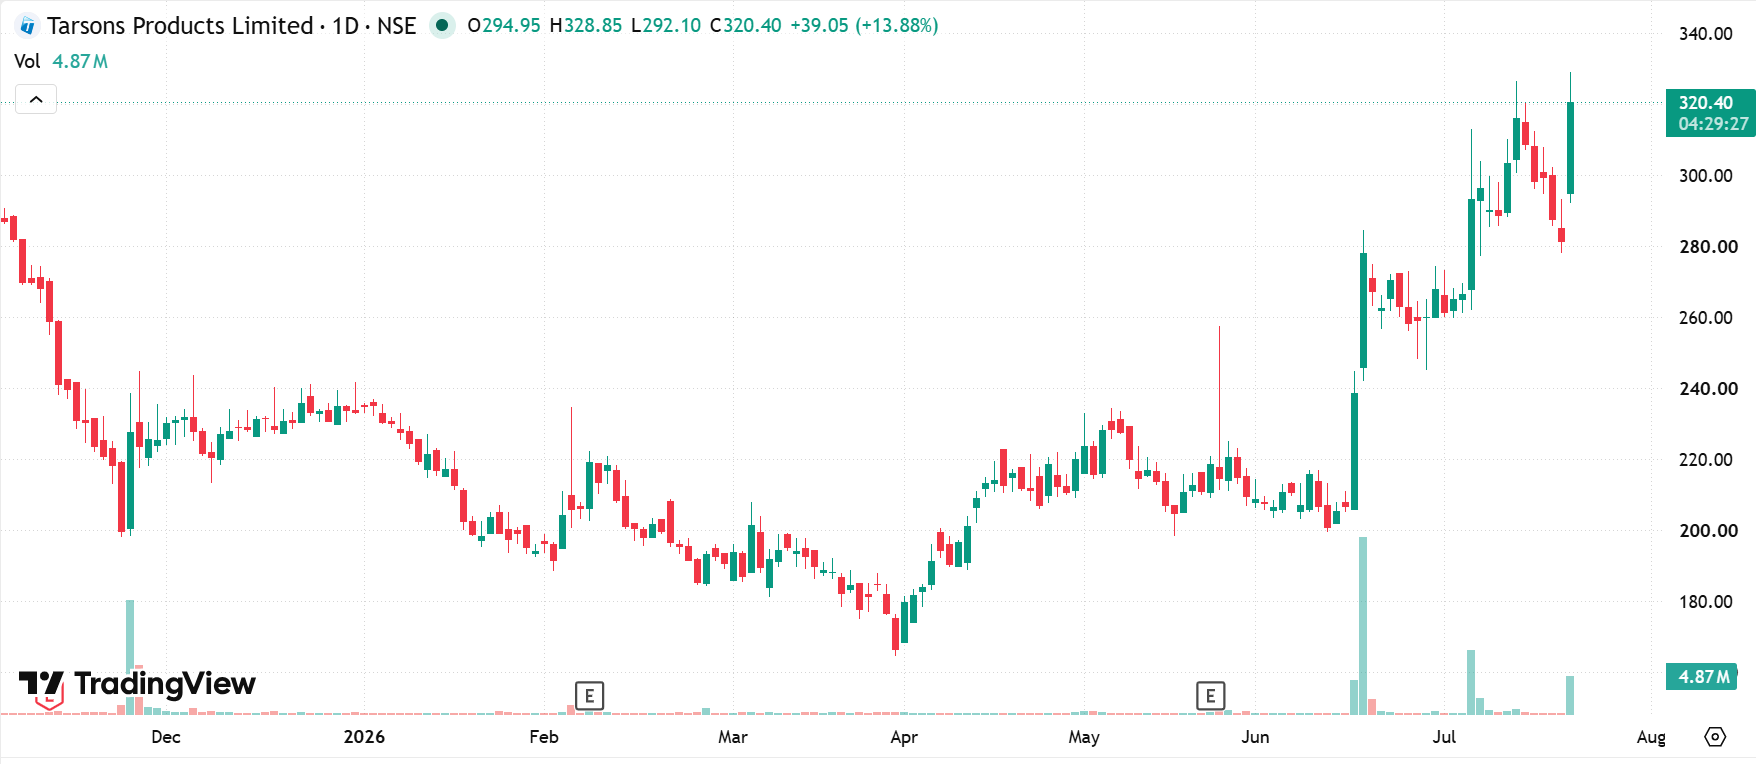 Chart By TradingView
Key Risks
- Healthcare demand changes may influence product sales and revenue growth.
- Raw material cost fluctuations can affect operating margins.
- Competition in laboratory products may impact market positioning.
- Regulatory requirements may affect product manufacturing processes.
Summary
Tarsons Products gained 12.85% during market trading, emerging among the top gainers. The company reported consolidated total income of ₹12,753.70 lakh for the audited March 2026 period. Profit before tax stood at ₹576.90 lakh, while net profit was reported at ₹418.10 lakh. The company operates in laboratory and healthcare plasticware manufacturing.
FAQs
Q: Why is Tarsons Products in focus today?
A: Tarsons Products gained 12.85% during trading, placing the stock among the session’s notable gainers.
Q: What was Tarsons Products’ net profit in March 2026?
A: The company reported consolidated net profit of ₹418.10 lakh for the audited March 2026 period.
Q: What does Tarsons Products manufacture?
A: Tarsons Products manufactures laboratory plasticware products used across healthcare and research applications.