

Highlights
- TIL shares declined nearly 10% despite reporting quarterly revenue growth.
- March quarter results showed continued losses, weighing on market sentiment.
- Stock slipped below its 21-day SMA as momentum indicators weakened.
Overview
TIL Limited (NSE: TIL) remained under pressure on May 29, with the stock falling 9.49% to INR 180.00. The decline came after the company announced its March 2026 quarter results, prompting investors to reassess the earnings outlook.
The stock opened at INR 196.00 and touched an intraday low of INR 178.00, reflecting broad selling pressure. While revenue improved during the quarter, market participants appeared focused on the company's continued losses and near-term profitability challenges.
Fundamental View
For the quarter ended March 2026, TIL reported standalone total income of INR 10,943 lakh. However, the company posted a loss before tax of INR 1,185 lakh and a net loss of INR 1,008 lakh. Earnings per share came in at negative INR 1.47.
Although revenue generation remained healthy, the inability to return to profitability may have contributed to the sharp market reaction. Investors often place greater emphasis on earnings visibility, particularly after periods of heightened stock volatility.
Technical View
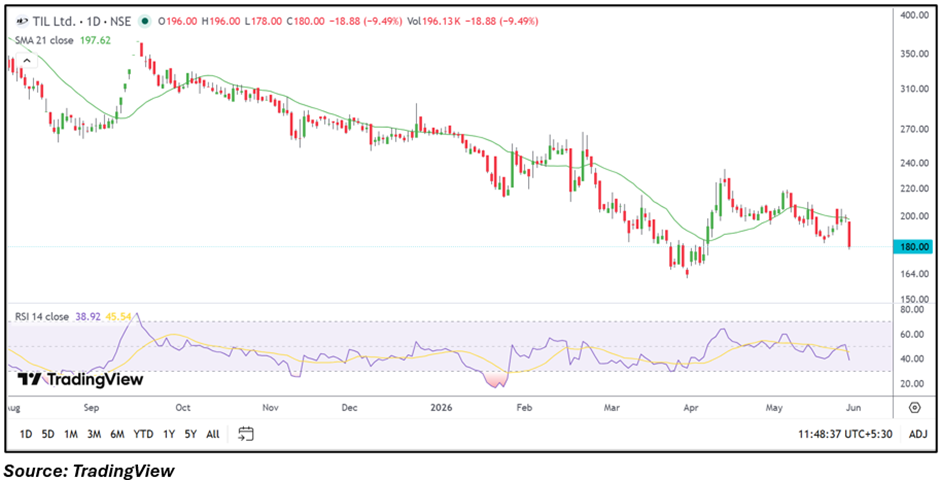
TIL is currently trading at INR 180.00, below its 21-day SMA of INR 197.62, indicating a weak near-term technical structure. Recent price action suggests that the stock failed to sustain around higher trading levels and witnessed renewed selling pressure after the earnings announcement.
The sharp decline has pushed the stock toward an important support region, while the overall trend remains cautious unless prices reclaim the short-term moving average.
Momentum Indicator
The 14-day RSI stands at 38.92, remaining below the neutral 50 level. This suggests weakening momentum and reflects the recent decline in price. The indicator has moved closer to oversold territory, highlighting the intensity of the latest correction.
Key Technical Levels
At the current market price of INR 180.00, immediate support is placed near INR 171.00, while the next major support level is around INR 162.00. On the upside, resistance is positioned near INR 189.00, followed by a stronger hurdle around INR 198.00. A sustained move above these resistance zones could improve the near-term structure, while a break below support may keep pressure on the stock.
Risks to Watch
- Continued quarterly losses may impact sentiment.
- Trading below the 21-day SMA could limit recovery attempts.
- Elevated volatility may trigger sharp price swings.
- Weak momentum indicators may keep buyers cautious.
Summary
TIL shares witnessed significant profit booking after the latest quarterly results despite reporting revenue of INR 10,943 lakh. Investors appeared concerned about the company's continued net loss of INR 1,008 lakh, leading to a sharp decline in the stock price. Technically, the stock remains below its 21-day SMA, while RSI indicates weakening momentum. Support levels near INR 171.00 and INR 162.00 will remain crucial in the sessions ahead.
FAQs
- Why did TIL shares fall after the latest results?
The stock declined as investors reacted to the company's continued net loss despite reporting higher revenue.
- What are the key support levels for TIL stock?
Immediate support is around INR 171.00, followed by a stronger support zone near INR 162.00.
- What resistance levels should traders monitor?
Key resistance levels are placed near INR 189.00 and INR 198.00.