

Highlights
- Vishwaraj Sugar Industries Limited (NSE: VISHWARAJ) gained 19.86% in the latest trading session.
- June 2026 total income stood at ₹11,022.41 lakh, while the company reported a net loss of ₹2,583.57 lakh.
- The stock opened at ₹5.73 and moved to a high of ₹6.82 after touching a low of ₹5.71.
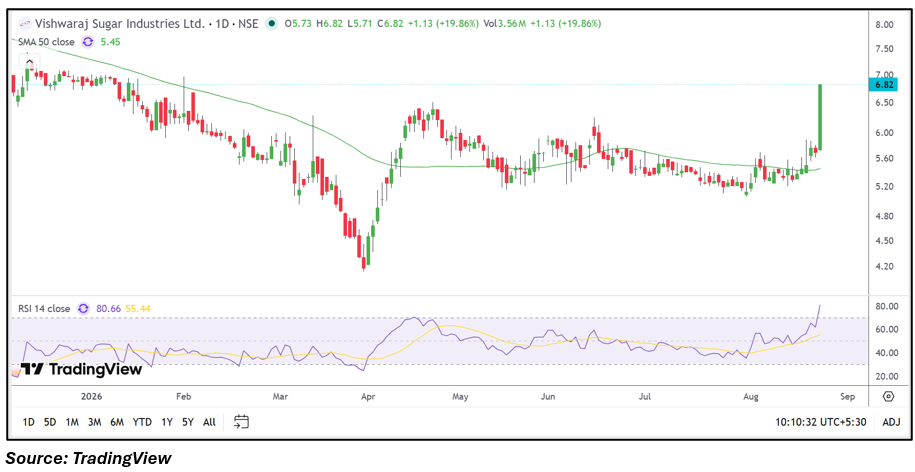
- The price is trading above the 50-day SMA of ₹5.45, while RSI has risen to 80.66.
- Trading volume reached 3.56 million shares, reflecting a significant increase in market activity.
- Investors should monitor the elevated RSI, price structure, trading volume, financial performance and future business developments.
Overview
Vishwaraj Sugar Industries Limited (NSE: VISHWARAJ) is engaged in the sugar and related businesses, with activities linked to sugar production and associated operations. On 24-Aug-2026, the stock opened at ₹5.73 and reached a high of ₹6.82 after recording a low of ₹5.71. The current price stood at ₹6.82, representing a gain of ₹1.13, or 19.86%, from the previous close of ₹5.69. The stock's VWAP was ₹6.41, indicating that trading remained concentrated at elevated levels during the session. The sharp upward move has taken the stock further above its 50-day SMA and has been accompanied by substantial volume. The overall market reaction reflects heightened interest in the stock following its recent price movement.
Fundamental View
For the quarter ended June 2026, Vishwaraj Sugar Industries reported standalone total income of ₹11,022.41 lakh, while profit before tax stood at a loss of ₹2,583.57 lakh. Net loss was also ₹2,583.57 lakh, resulting in an EPS of negative ₹1.19. The reported figures indicate continued pressure on quarterly profitability despite the level of reported income. The business outlook remains influenced by sugar prices, production volumes, raw material costs, ethanol-related opportunities, energy costs and seasonal operating conditions. Future monitoring points include revenue consistency, cost management, margins, cash flows, debt levels and the company's ability to improve profitability in subsequent quarters.
Technical View
The daily chart shows a sharp upward move, with Vishwaraj Sugar Industries trading at ₹6.82 compared with its 50-day SMA of ₹5.45. The stock has moved decisively above the moving average after spending an extended period around lower trading levels. RSI 14 stands at 80.66, placing the indicator in an elevated zone and showing strong short-term momentum. The latest session recorded a high of ₹6.82 and a low of ₹5.71, creating a wide trading range. Volume of 3.56 million shares further confirms increased trading activity. The price structure has changed significantly, while the elevated RSI indicates that momentum has accelerated sharply and could remain sensitive to subsequent price fluctuations.
Key Technical Levels
Support is around ₹6.48, followed by ₹6.14. Resistance is around ₹7.16, followed by ₹7.50. The 50-day SMA at ₹5.45 remains another important chart reference for monitoring the medium-term price structure and any change in the recent momentum.
Risks to Watch
- Elevated RSI can coincide with increased short-term price volatility.
- A move back below the 50-day SMA could weaken the recent technical structure.
- Continued losses may remain a concern for the company's fundamental profile.
- Sugar prices, production costs and seasonal conditions can affect operating performance.
- High trading activity can result in wider price fluctuations during subsequent sessions.
Summary
Vishwaraj Sugar Industries Limited (NSE: VISHWARAJ) has attracted significant market attention after gaining 19.86% during the latest session. The stock is trading above its 50-day SMA of ₹5.45, while RSI at 80.66 and volume of 3.56 million shares indicate elevated short-term momentum and activity. Fundamentally, the June 2026 quarter reported total income of ₹11,022.41 lakh alongside a net loss of ₹2,583.57 lakh and negative EPS of ₹1.19. Going forward, the price structure, RSI, volume, profitability, cost trends, sugar-market conditions and subsequent quarterly performance will remain important factors to monitor.
FAQs
Q: Why is Vishwaraj Sugar Industries stock rising today?
A: The stock gained 19.86% during the latest session, accompanied by elevated trading volume and a sharp improvement in its short-term technical structure.
Q: What is the current price of Vishwaraj Sugar Industries?
A: The stock was trading at ₹6.82 based on the supplied market data for 24-Aug-2026.
Q: What is the 50-day SMA of Vishwaraj Sugar Industries?
A: The 50-day SMA shown on the daily chart is ₹5.45.
Q: What were Vishwaraj Sugar Industries' June 2026 results?
A: Total income was ₹11,022.41 lakh, while profit before tax and net profit were both reported at a loss of ₹2,583.57 lakh. EPS was negative ₹1.19.
Q: What are the key technical levels for VISHWARAJ?
A: Support is around ₹6.48 and ₹6.14, while resistance is around ₹7.16 and ₹7.50. The 50-day SMA at ₹5.45 is another level to monitor.