
Company Overview
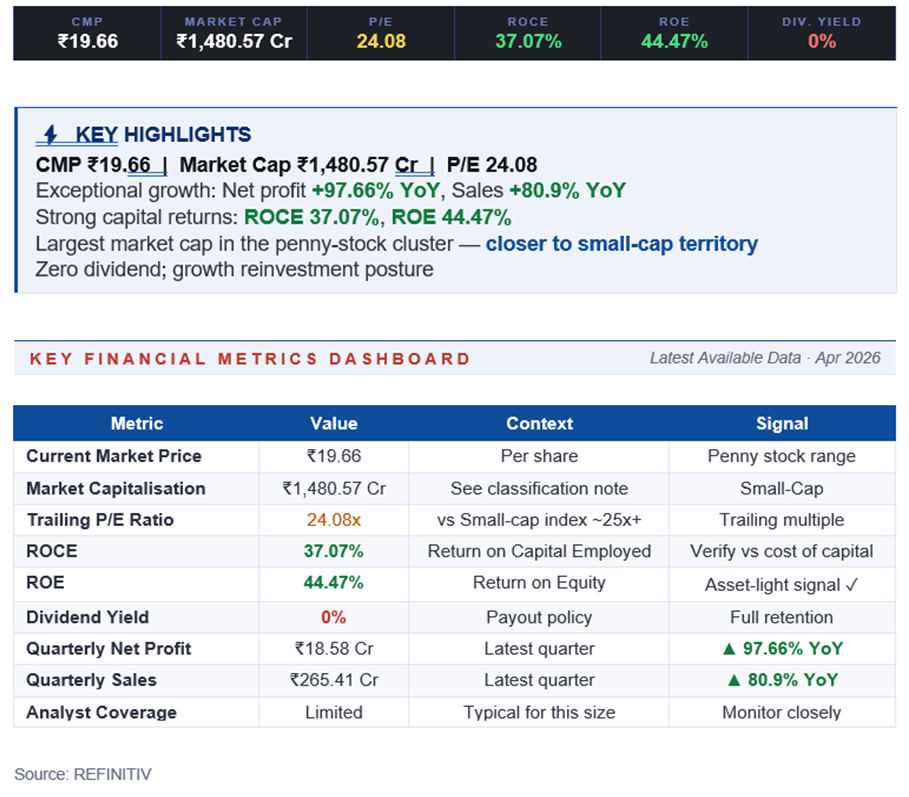
Blue Cloud Software operates in India's IT services and software solutions sector. With a market capitalisation of ₹1,480.57 crore, it is the largest company in this penny-stock cluster — its penny-stock status is purely a function of its low nominal share price of ₹19.66, not its business scale. Indian IT services continues to benefit from global digital transformation spend, cloud migration budgets, and enterprise modernisation programmes.
The combination of high growth (sales up 81% YoY) and healthy return ratios (ROCE 37%, ROE 44%) suggests Blue Cloud has identified a product-market fit that is currently enjoying strong demand. The company's size — neither too small to be dismissed nor too large to grow quickly — puts it in the sweet spot for compounding, provided execution holds up.
Price Performance
At ₹19.66 and a ₹1,480 crore market cap, Blue Cloud has meaningfully better liquidity than most names in the penny-stock universe. Trading volumes at this market cap typically support institutional interest, and the stock benefits from broader small-cap index flows.
Price performance will correlate with IT-sector sentiment, quarterly earnings, and the broader risk-on/risk-off cycle for small and mid-caps. Investors should watch delivery-volume trends and any institutional disclosures as indicators of ownership quality improving over time.
Shareholder Returns
Blue Cloud pays no dividend (0% yield), which is consistent with the typical posture of a growth-stage IT services firm. With ROE near 44%, retained earnings compound at a higher rate than most shareholders could achieve independently — making reinvestment the economically correct choice.
Total shareholder return is expected to come entirely from capital appreciation driven by earnings growth and, potentially, multiple expansion as the company moves toward mid-cap classification over time.
Financials
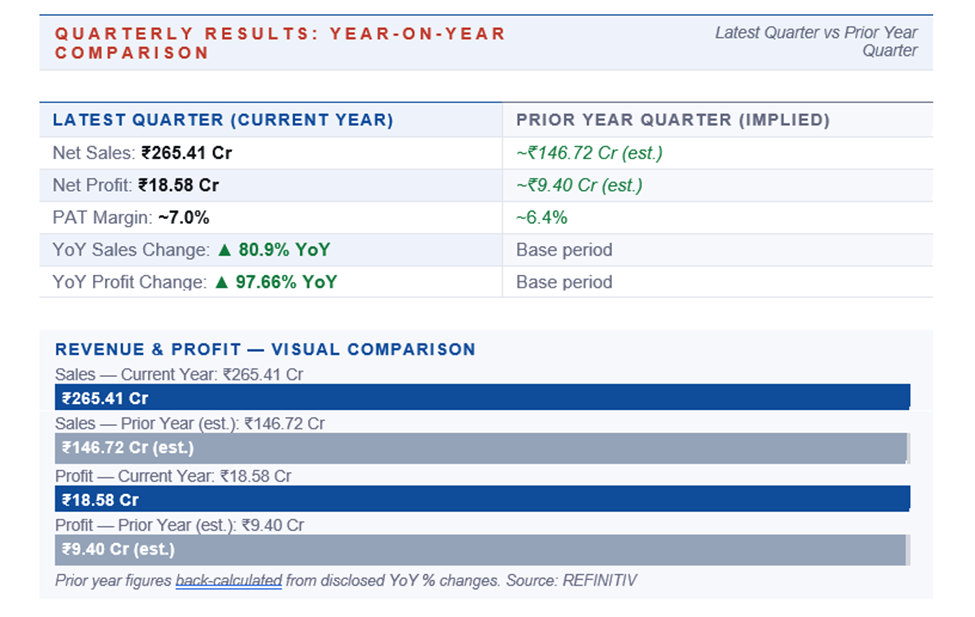
The numbers are exceptional. Quarterly net profit jumped 97.66% YoY to ₹18.58 crore, on quarterly sales of ₹265.41 crore (up 80.9% YoY). Profit growth ahead of sales growth indicates operating leverage — a very favourable pattern for a services business where incremental revenue flows at high margin once fixed overheads are covered.
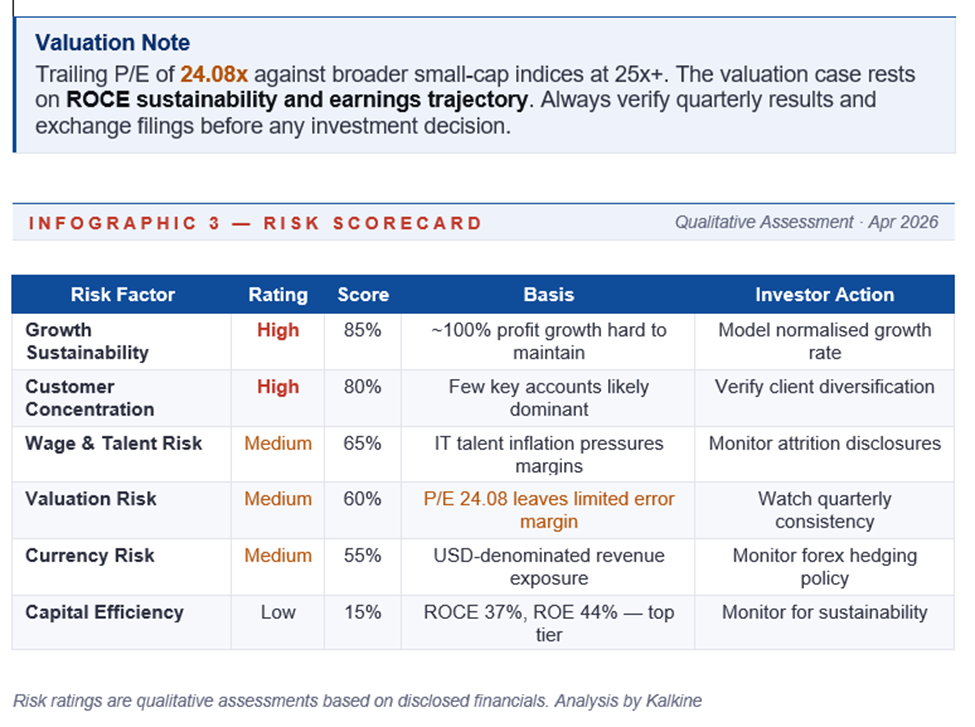
Trailing ROCE of 37.07% and ROE of 44.47% indicate strong capital productivity. The P/E of 24.08 is readily justified by the growth profile — the PEG is well below 1, a metric growth investors typically find attractive. Consistency of this growth over the next three to four quarters will be the key determinant of whether the P/E expands further or compresses.
Risks
- Growth-sustainability risk: A 97% profit jump and 81% revenue jump are very difficult to compound indefinitely; mean reversion toward 15–20% growth is the base case over the medium term.
- Customer-concentration risk: Small and mid-cap IT firms often derive a large portion of revenue from a handful of key accounts.
- Pricing and margin risk: In a competitive IT market, pricing pressure from clients and wage inflation can compress margins simultaneously.
- Currency risk: If a meaningful portion of revenue is USD-denominated, rupee appreciation can reduce reported revenue growth.
- Talent attrition: High attrition raises hiring and training costs and can disrupt project delivery.
Business Strategy
Blue Cloud's current strategy, inferred from the growth profile, appears to be focused on rapid client-base expansion within a specific technology or vertical niche. The combination of revenue growth and margin expansion suggests the company is both winning new work and delivering efficiently on existing contracts.
The strategic tests going forward are: can client concentration be reduced as revenue scales; can the company build repeatable delivery frameworks that sustain margins even as it adds mid-tier talent; and is there a credible path to adding productised services or IP-based offerings that improve structural margins.
Valuation
Blue Cloud's P/E of 24.08 is the highest in the immediate penny-stock comparison set, but arguably the most defensible given its growth and size. In the context of broader Indian small-cap IT services peers, a P/E in the 20–30x range is typical for double-digit growers; Blue Cloud's >80% revenue growth makes this multiple look conservative.
Frequently Asked Questions
What does Blue Cloud Software do?
Blue Cloud operates in India's IT services and software solutions sector. Details on specific verticals and technology focus should be verified from the company's annual report.
Is Blue Cloud a penny stock?
Its share price of ₹19.66 puts it in the penny-stock price band, but its ₹1,480 crore market cap makes it closer to a small-cap in every operational sense.
Why has Blue Cloud's profit grown so fast?
Profit growth of 97.66% YoY reflects strong revenue growth combined with operating leverage. Sustained growth at this pace is unusual; some normalisation is expected over the medium term.
Does Blue Cloud pay dividends?
No. The dividend yield is 0%; earnings are retained to fund growth.
What's the P/E and is it expensive?
The P/E is 24.08. Given nearly 100% profit growth, the PEG ratio is well below 1, which many growth investors consider attractive. However, the multiple assumes continued strong execution.