
Highlights
- Tata Technologies stock rose nearly 8 percent following release of FY26 financial results.
- Consolidated profit and revenue showed growth, supporting positive market reaction during the trading session.
- Trading volumes remained high, indicating strong investor participation and short-term momentum in the stock.
Tata Technologies Limited (NSE:TATATECH) shares gained 7.57% to ₹635.80 on May 5, 2026, compared to the previous close of ₹591.05
The stock opened at ₹602.05 and touched an intraday high of ₹659.80, reflecting strong buying interest during the session
Trading activity remained active with volumes of over 237 lakh shares and traded value exceeding ₹1,525 Cr
Financial Performance FY26
For the quarter and year ended March 31, 2026, the company reported the following numbers
On a consolidated basis, total income stood at ₹1,60,318 lakh while profit before tax was ₹27,669 lakh
Net profit came at ₹20,417 lakh with earnings per share of ₹5.03
On a standalone basis, total income was ₹86,330 lakh with profit before tax of ₹20,941 lakh
Net profit stood at ₹15,913 lakh and earnings per share was ₹3.92
Returns and Market Performance
The stock has delivered 11.53% return over the past one week and 17.45% over one month
However, on a one-year basis, the stock declined 4.59%, underperforming the broader NIFTY 500 which gained 2.25%
Year-to-date performance shows a marginal decline of 1.36% compared to a 5.09% drop in the index
Valuation and Trading Metrics
The company has a total market capitalisation of ₹25,849 Cr with a free float market cap of ₹10,881 Cr
The stock remains below its 52-week high of ₹797 and above its 52-week low of ₹507.40
Daily volatility stands at 1.74% while annualised volatility is reported at 33.24%
Market Activity Indicators
The deliverable quantity stood at 14.38% of total traded volume, suggesting a mix of short-term and positional trading
The impact cost remained low at 0.04, indicating good liquidity in the counter
Key Risks
- Stock volatility may increase due to short-term trading activity
- Earnings growth may be sensitive to global demand conditions
- Valuation may fluctuate with changes in investor sentiment
- Dependence on client spending cycles can affect revenue visibility
Share Performance
Tata Technologies Limited (NSE) is currently witnessing a sharp breakout, surging +7.57% to traded at 635.80 on May 5, 2026. This significant single-day gain has pushed the price well above its 51-day SMA of 566.70, ending a period of consolidation. Trading volume has spiked remarkably to 23.91M.
The RSI (14) has jumped to 67.74, moving sharply above its signal line of 56.10, which indicates a strong surge in bullish momentum as the stock approaches overbought territory.
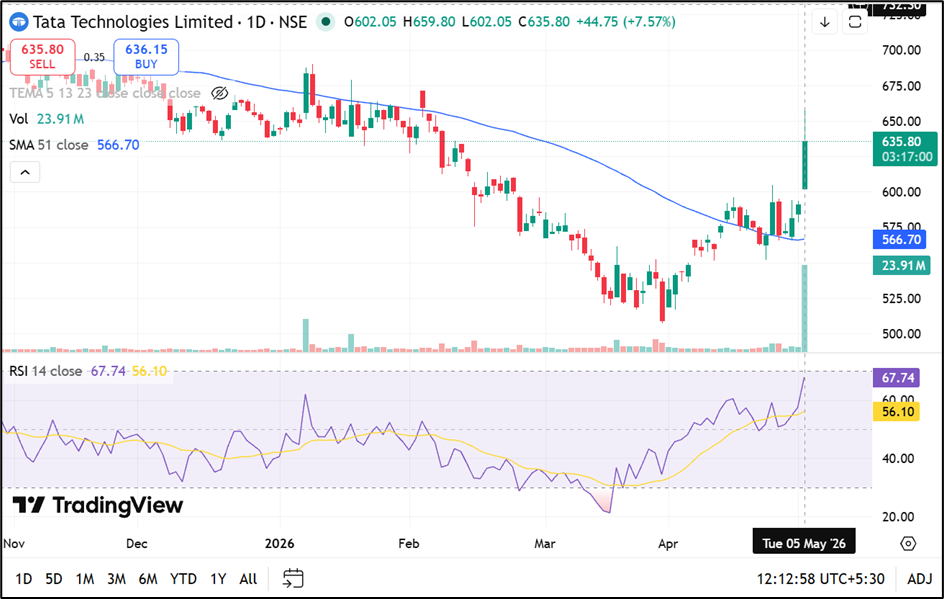
Source: TradingView
Summary
Tata Technologies (NSE:TATATECH) shares rose nearly 8% after FY26 results, supported by improved financial performance and strong trading volumes. While short-term returns remain positive, the stock has shown mixed performance over a longer period. Market activity indicates active participation, but volatility and dependence on global demand trends remain important factors influencing future stock movement
FAQs
- Why did Tata Technologies stock rise today
The stock increased after FY26 results showing profit growth and improved investor participation in the market - What are the key financial highlights for FY26
Consolidated income stood at ₹1,60,318 lakh and net profit was ₹20,417 lakh with EPS of ₹5.03 - How has the stock performed recently
The stock gained over 11% in one week and 17% in one month despite a decline over one year