
Highlights
- Cheviot Company stock surged 5%, hitting a fresh 52-week high.
- The stock delivered 27.88% returns in one month, outperforming broader indices.
- Trading volumes remained moderate despite sharp price movement during the session.
Shares of Cheviot Company Limited (NSE:CHEVIOT) were trading at ₹1,266.20 on May 6, 2026, up 4.69% from the previous close of ₹1,209.50. The stock opened at ₹1,230.00 and touched an intraday high of ₹1,305.00, which also marks its 52-week high. The day’s low stood at ₹1,212.00, indicating sustained upward momentum through the session.
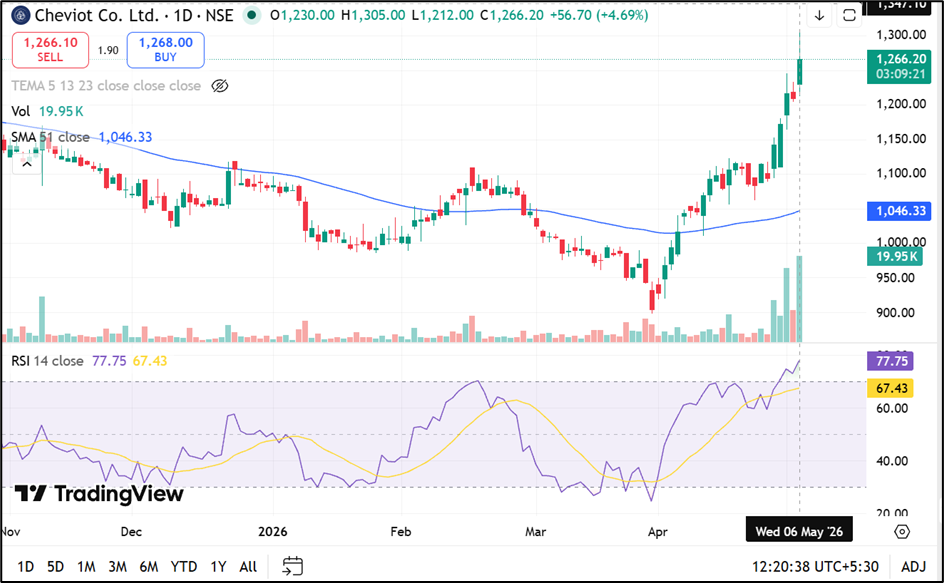
Source: TradingView
Return Performance Compared to Benchmark
The stock has delivered notable returns across short-term periods. Over the past one week, it gained 11.25%, compared to a decline of 0.43% in the NIFTY 50 index.
On a one-month basis, the stock rose 27.88%, outperforming the benchmark index, which gained 4.82% during the same period. Year-to-date returns stand at 17.22%, while one-year returns are at 22.84%, both exceeding benchmark performance.
However, over a three-year period, the stock delivered 12.40%, underperforming the NIFTY 50 return of 33.24%. Five-year returns remained flat compared to the benchmark’s 63.50% gain.
Trading Activity and Liquidity Indicators
The trading volume for the session stood at 0.20 lakh shares, translating into a traded value of approximately ₹2.50 crore. The stock’s impact cost was reported at 0.45, indicating moderate liquidity conditions.
The deliverable quantity as a percentage of traded volume stood at 58.46%, suggesting a relatively higher proportion of delivery-based trades.
Market Capitalisation and Volatility
Cheviot Company has a total market capitalisation of ₹742.33 crore, with a free float market cap of ₹169.51 crore.
The stock’s daily volatility was recorded at 1.65%, while annualised volatility stood at 31.52%. The price band for the stock is set at 20%, with upper and lower bands at ₹1,451.40 and ₹967.60 respectively.
52-Week Range and Technical Levels
The stock’s 52-week high of ₹1,305.00 was reached during the current session, while the 52-week low stands at ₹898.00, recorded on March 30, 2026. The recent breakout to new highs indicates a shift in trading range over the short term.
Key Risks
- Low trading volumes may lead to higher price volatility and sharp movements.
- Concentrated shareholding could impact liquidity and price discovery.
- Sector-specific demand fluctuations may affect revenue visibility.
- Broader market corrections may influence small-cap stock performance disproportionately.
Summary
Cheviot Company (NSE:CHEVIOT) shares rose 5% to ₹1,270, hitting a new 52-week high during the session. The stock has delivered strong short-term returns, outperforming benchmark indices over one week and one month periods.
Despite moderate trading volumes, price momentum remained positive. Long-term performance remains mixed, with underperformance visible over a three-year horizon compared to broader markets.
FAQs
Q: Why did Cheviot Company stock rise today?
A: The stock gained 5% and hit a 52-week high amid positive price momentum and short-term outperformance.
Q: How has the stock performed recently?
A: It delivered 11.25% returns in one week and 27.88% in one month, outperforming benchmarks.
Q: What is the stock’s 52-week range?
A: The stock’s 52-week high is ₹1,305.00, while the 52-week low is ₹898.00.