
Highlights
- Hindustan Unilever shares rose nearly 2 percent during Thursday’s trading session.
- FMCG stock traded close to its 52-week low despite intraday buying activity.
- Deliverable quantity remained above 66 percent amid active market participation.
Shares of Hindustan Unilever Limited (NSE:HINDUNILVR) traded higher on 22 May 2026, with the stock gaining 1.97 percent during the afternoon session. The Hindustan Unilever share price was at Rs 2,221.90, compared to the previous close of Rs 2,179.00 on the NSE.
The stock opened at Rs 2,180.00 and touched an intraday high of Rs 2,223.70. The day’s low stood at Rs 2,175.40, indicating a relatively narrow trading range during the session. Volume activity remained active, with 5.68 lakh shares traded and turnover reaching nearly Rs 124.98 crore.
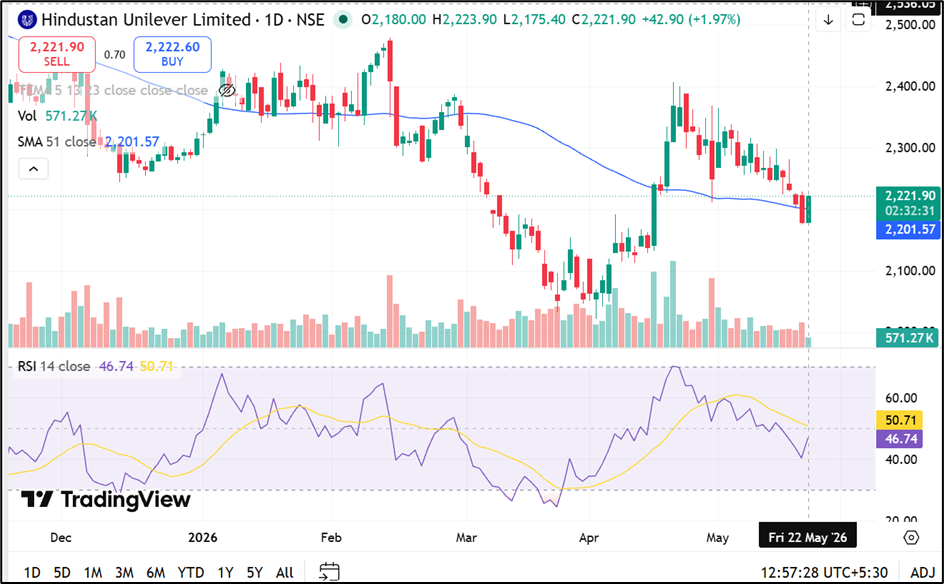
Source: TradingView
Market Capitalisation And Trading Indicators
Hindustan Unilever’s total market capitalisation stood at approximately Rs 5.22 lakh crore during the session. The company’s free float market capitalisation was around Rs 1.96 lakh crore.
The stock recorded a daily volatility of 1.29 percent, while annualised volatility stood at 24.65 percent. The impact cost was reported at 0.02, reflecting relatively high liquidity in trading activity.
Deliverable quantity accounted for 66.25 percent of traded quantity, indicating a sizable portion of trades resulted in delivery-based transactions instead of intraday activity.
FMCG Business Overview
Hindustan Unilever operates in the FMCG segment with business divisions spanning Home Care, Beauty and Personal Care, and Foods and Refreshment categories. The company has manufacturing facilities across India and primarily caters to the domestic market.
Stock Trades Below Earlier High Levels
Hindustan Unilever shares continue to trade below their 52-week high of Rs 2,750.00 recorded on 4 September 2025. The stock’s 52-week low stands at Rs 2,022.50, touched on 2 April 2026.
On a yearly basis, the stock has delivered negative returns of 4.64 percent, slightly underperforming the NIFTY 50 index decline of 3.18 percent during the same period. Over a three-year period, the stock has declined 15.75 percent, while the benchmark index advanced 30.10 percent.
The five-year return comparison also reflected subdued performance relative to the broader market. Hindustan Unilever delivered negative returns of 5.91 percent during the period, while the NIFTY 50 gained 57.01 percent.
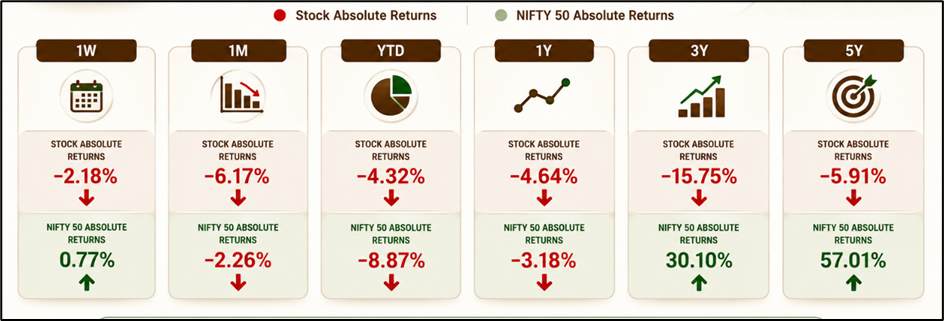
Source: NSE
Key Risks
- Rising input costs may affect operating margins across FMCG product categories.
- Competitive pricing pressure may impact market share in key segments.
- Rural demand fluctuations can influence sales growth and consumption trends.
- Volatility in commodity prices may affect production and distribution expenses.
Summary
Hindustan Unilever (NSE:HINDUNILVR) shares traded higher on 22 May 2026, rising nearly 2 percent during the session. The stock remained below its 52-week high levels despite active trading and delivery-based participation. Historical returns continued to lag benchmark index performance across multiple periods. Market participants also monitored volatility levels, liquidity indicators, and broader FMCG sector activity during the trading session.
FAQs
Q: Why did Hindustan Unilever shares rise on 22 May 2026?
A: The stock gained nearly 2 percent amid active trading volumes and delivery-based market participation.
Q: What was Hindustan Unilever’s 52-week high price?
A: The stock recorded its 52-week high of Rs 2,750.00 on 4 September 2025.
Q: What businesses does Hindustan Unilever operate in?
A: The company operates across Home Care, Beauty and Personal Care, and Foods and Refreshment segments.