
Highlights
- Kalyan Jewellers shares declined more than 4% during Tuesday morning trade.
- The stock touched a fresh 52-week low amid elevated market activity.
- Trading volumes crossed 75 lakh shares during the early NSE session.
Shares of Kalyan Jewellers India Limited (NSE:KALYANKJIL) declined sharply during the morning trading session on May 13, 2026, with the stock falling 4.19% to INR 346.65 on the National Stock Exchange. The stock opened at INR 351.00 and moved within an intraday range of INR 340.55 to INR 351.05.
The decline pushed the stock to its fresh 52-week low of INR 340.55, compared with its 52-week high of INR 617.70 recorded on July 24, 2025. The previous closing price stood at INR 361.80.
Market activity remained elevated as traded volume reached 75.72 lakh shares, while traded value stood at nearly INR 262.30 crore during the session.
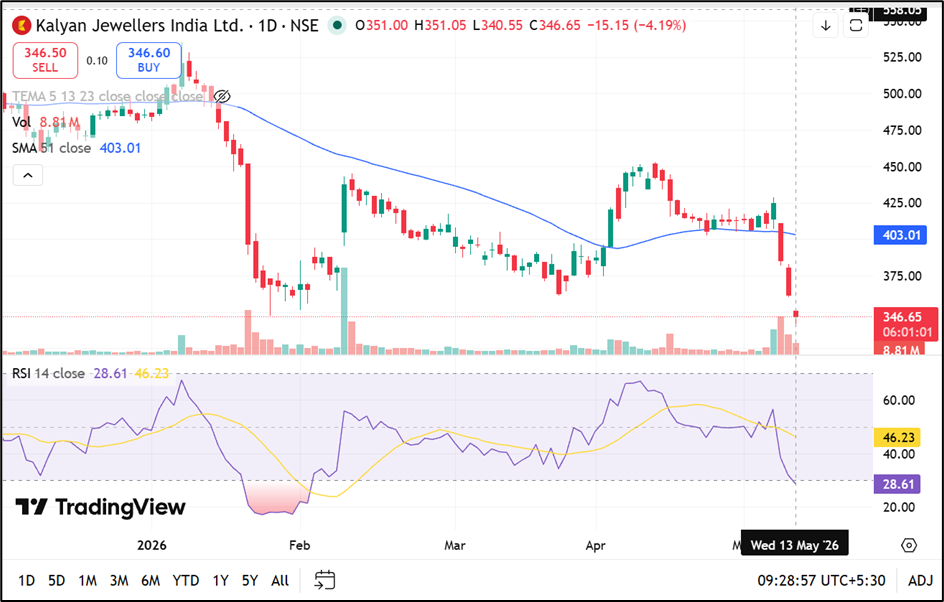
Source: TradingView
Return Performance Reflects Selling Pressure
Kalyan Jewellers’ recent return profile reflects continued pressure across shorter timeframes. The stock has declined 16.62% over the past one week and 21.53% over the last month.
On a year-to-date basis, the stock has fallen 28.43%, while one-year returns showed a decline of 37.50%. However, longer-duration performance remained higher, with three-year returns at 219.25% and five-year returns at 455.81%.
In comparison, NIFTY 200 returns stood at negative 3.45% over one week and positive 0.03% over one month.
Market Capitalisation and Trading Metrics
The company’s total market capitalisation stood at approximately INR 35,768.96 crore, while free float market capitalisation was around INR 13,273.19 crore.
The stock reported an impact cost of 0.03 and daily volatility of 2.79. Annualised volatility stood at 53.30, indicating active price movement in recent sessions.
The applicable margin rate was recorded at 21.72%, while deliverable quantity as a percentage of traded quantity stood at 27.54%.
Jewellery Retail Presence Across Segments
Kalyan Jewellers India Ltd designs, manufactures and sells gold, studded and other jewellery products across multiple price categories. The company operates as one of India’s jewellery retailers based on FY20 revenue data.
The company was founded by Chairman, Managing Director and Promoter T.S. Kalyanaraman.
Q4FY26 Performance
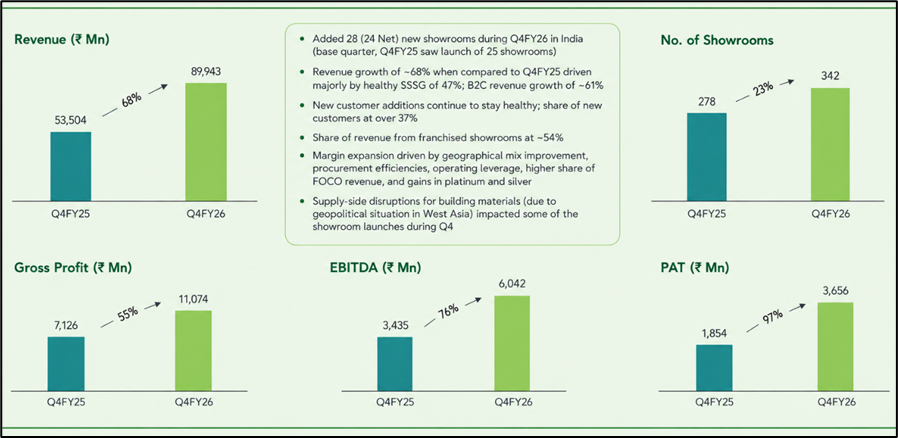
Source: Company Filing
Key Risks
- High gold price volatility may impact jewellery demand and purchasing patterns.
- Retail sector competition may affect pricing and customer acquisition strategies.
- Elevated stock volatility could increase short-term trading fluctuations.
- Consumer spending slowdown may affect discretionary jewellery purchases.
Summary
Kalyan Jewellers India Limited (NSE:KALYANKJIL) shares declined over 4% during the May 13, 2026 trading session on NSE, touching a fresh 52-week low amid elevated market activity. The stock witnessed heavy trading volumes and continued short-term weakness across weekly and monthly periods. Despite recent declines, longer-term returns over three and five years remained significantly higher compared with broader benchmark performance.
FAQs
Q: Why did Kalyan Jewellers shares decline on May 13, 2026?
A: The stock declined amid selling pressure and touched its fresh 52-week low during active NSE trading.
Q: What was Kalyan Jewellers’ 52-week low price?
A: The stock touched a 52-week low of INR 340.55 during the May 13, 2026 session.
Q: How much trading volume was recorded in Kalyan Jewellers shares?
A: Traded volume crossed 75 lakh shares during the early trading session on NSE.