
Highlights
- TTK Prestige shares surged nearly 10% during Tuesday’s NSE trading session.
- The stock entered the list of top gainers amid increased market activity.
- TTK Prestige traded near the upper price band during the session.
TTK Prestige Limited (NSE:TTKPRESTIG) shares rallied during the May 12 session on the National Stock Exchange. The stock was trading at INR 563.35, up 8.67% from the previous close of INR 518.40.
The stock opened at INR 522.90 and climbed to an intraday high of INR 597.55. The session low stood at INR 517.05, reflecting significant price movement during trade.
TTK Prestige shares were among the top gainers during the session and continued trading below their 52-week high of INR 771.20 recorded on October 28, 2025.
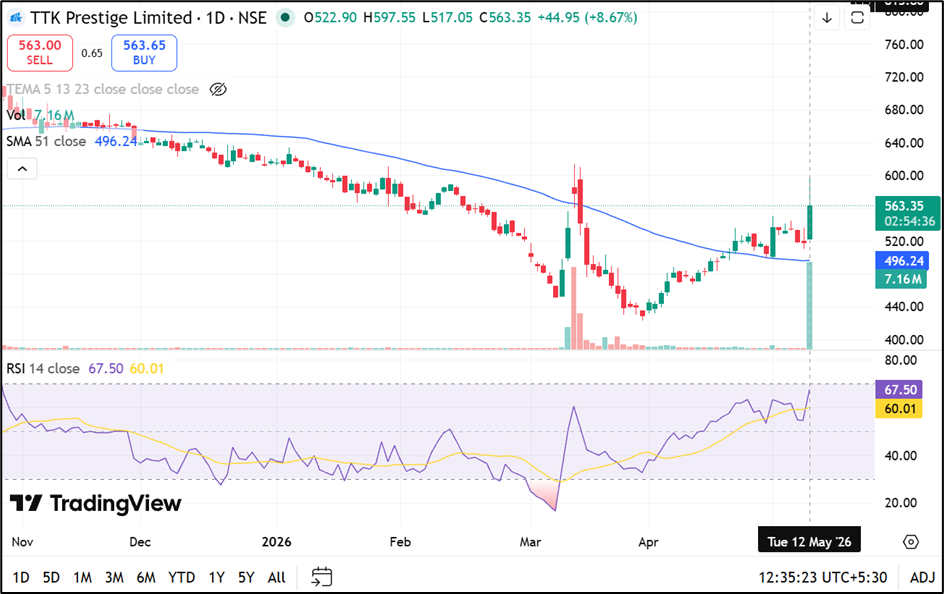
Source: TradingView
Trading Volumes and Market Capitalisation
The stock recorded traded volume of 67.76 lakh shares during the session, while traded value stood at INR 392.49 crore.
The company’s total market capitalisation stood at INR 7,792.51 crore, while free float market capitalisation was INR 2,259.65 crore. The stock’s VWAP during the session was INR 579.29.
Deliverable quantity as a percentage of traded quantity stood at 11.67%, while the impact cost remained at 0.15.
Performance Compared With NIFTY 50
TTK Prestige shares outperformed the NIFTY 50 index across shorter-term periods.
The stock gained 6.20% over one week and 18.88% over one month, while the benchmark NIFTY 50 index declined during both periods.
On a year-to-date basis, TTK Prestige shares declined 7.75%, compared with a 9.85% decline in the benchmark index.
However, over one year, three years, and five years, the stock underperformed the NIFTY 50 index.
Valuation Indicator and Volatility
Exchange data indicated that the stock’s price-to-earnings ratio remained above 50 for the previous four trailing quarters.
The stock recorded annualised volatility of 40.31%, while daily volatility stood at 2.11.
TTK Prestige touched its 52-week low of INR 423.00 on March 30, 2026. The applicable margin rate stood at 18.09%, while the face value remained INR 1 per share.
According to the company profile, TTK Prestige operates in the kitchenware and kitchen appliances segment and remains among India’s major pressure cooker and kitchen equipment brands.
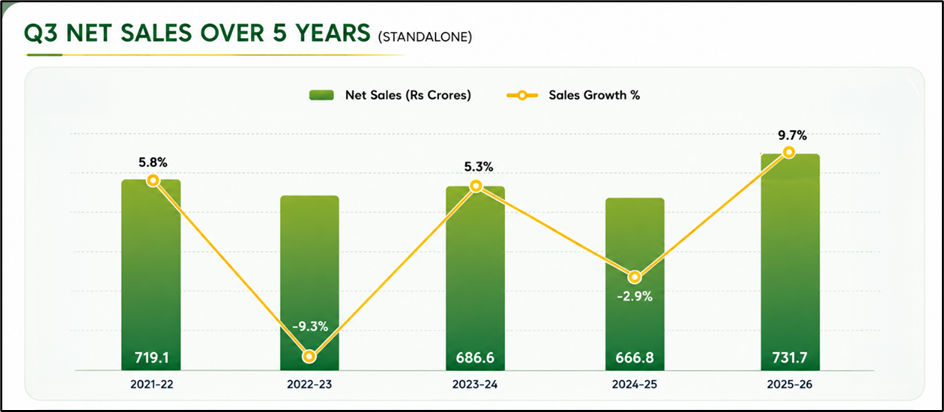
Source: Company Filing
Key Risks Investors Monitor
- Consumer demand slowdown may impact kitchenware product sales.
- High valuation metrics may affect investor sentiment.
- Raw material price fluctuations can influence operating costs.
- Competitive pressure may impact market share and pricing.
Summary
TTK Prestige (NSE:TTKPRESTIG) shares surged nearly 10% during Tuesday’s NSE trading session and entered the list of top gainers amid heavy buying activity. The stock outperformed the benchmark index across shorter-term periods while remaining below its 52-week high. Investors continue monitoring consumer demand trends, valuation indicators, raw material costs, and competition within the consumer durable sector.
FAQs
Q: What was TTK Prestige share price on May 12, 2026?
A: TTK Prestige shares traded at INR 569.40, up 9.84% during the NSE session.
Q: What is the 52-week high level of TTK Prestige shares?
A: The stock’s 52-week high was INR 771.20, recorded on October 28, 2025.
Q: What valuation indicator was highlighted for TTK Prestige stock?
A: Exchange data indicated the stock’s PE ratio exceeded 50 across four trailing quarters.