
Highlights
- Titan Company shares declined more than 1% during Monday's session.
- The stock touched an intraday low of Rs 4,368.00 amid active trading.
- Consolidated net profit stood at Rs 1,179 crore in Q4 FY26.
Titan Company Limited (NSE:TITAN) shares traded lower on June 22, 2026, with the stock falling 1.07% to Rs 4,374.20. The stock declined Rs 45.70 from its previous close of Rs 4,419.90. The shares opened at Rs 4,405.30 and moved within a range of Rs 4,368.00 to Rs 4,414.50 during the session. The stock remained under pressure through the morning trade.
Trading activity remained steady, with 1.52 lakh shares changing hands. The traded value stood at Rs 66.67 crore, while the volume-weighted average price (VWAP) was Rs 4,386.03.
Source: Analysis by Kalkine
Q4 FY26 Financial Performance
For the quarter ended March 31, 2026, Titan reported standalone total income of Rs 24,086 crore. Profit before tax stood at Rs 1,486 crore, while net profit came in at Rs 1,124 crore. Earnings per share for the quarter were Rs 13.00.
On a consolidated basis, total income stood at Rs 27,104 crore. Profit before tax was reported at Rs 1,576 crore, while net profit came in at Rs 1,179 crore. Consolidated earnings per share stood at Rs 13.00. The company announced its financial results on May 8, 2026.
Market Capitalisation And Valuation
Titan Company has a market capitalisation of Rs 3.88 lakh crore, while its free-float market capitalisation stands at Rs 1.80 lakh crore. The stock is currently trading at a price-to-earnings ratio of 77.36, while the adjusted P/E ratio stands at 76.22.
Exchange data indicates that the company's P/E ratio has remained above 50 during the previous four trailing quarters. Titan is a constituent of the Nifty 50 index and operates within the Gems, Jewellery and Watches industry. The company has been listed on Indian stock exchanges since September 24, 2004.
Return Performance Across Timeframes
Titan has outperformed the broader market across most investment horizons. During the last week, the stock gained 2.11%, compared with a 1.21% rise in the Nifty 50.
Over one month, the stock advanced 7.21%, significantly ahead of the benchmark's 1.79% gain. On a year-to-date basis, Titan has returned 8.01%, while the Nifty 50 declined 7.66%.
The stock has generated returns of 24.29% over one year, 47.25% over three years and 148.94% over five years, outperforming the benchmark across these periods.
Trading Range And Volatility Indicators
Titan touched its 52-week high of Rs 4,605.00 on May 8, 2026, while the 52-week low of Rs 3,303.10 was recorded on September 26, 2025. The stock currently trades without any price band restrictions. Daily volatility stands at 1.55%, while annualised volatility is reported at 29.61%. The impact cost of 0.02 indicates relatively liquid trading conditions.
Business Overview
Titan Company Ltd is among India's lifestyle companies with operations spanning watches, jewellery and eyewear. The company was founded in 1984 as a joint venture between the Tata Group and the Tamil Nadu Industrial Development Corporation (TIDCO).
Titan operates through multiple consumer brands and has established a presence across jewellery, watches, eyewear and related lifestyle categories through its retail network and customer-focused business model.
Key Risks To Watch
- Volatility in gold prices may affect jewellery demand.
- Changes in consumer spending can impact discretionary purchases.
- High valuation multiples may increase earnings sensitivity.
- Competitive pressures could influence market share and margins.
Today's Share Performance
Titan Company shares traded lower on June 22, 2026, declining 1.07% to Rs 4,372.40during morning trade. The stock touched an intraday low of Rs 4,368.00 after opening at Rs 4,405.30, while the session high stood at Rs 4,414.50. Trading volume reached 1.52 lakh shares, with turnover of Rs 66.67 crore.
At the current market price, Titan trades approximately 5.0% below its 52-week high of Rs 4,605.00 and about 32.4% above its 52-week low of Rs 3,303.10.
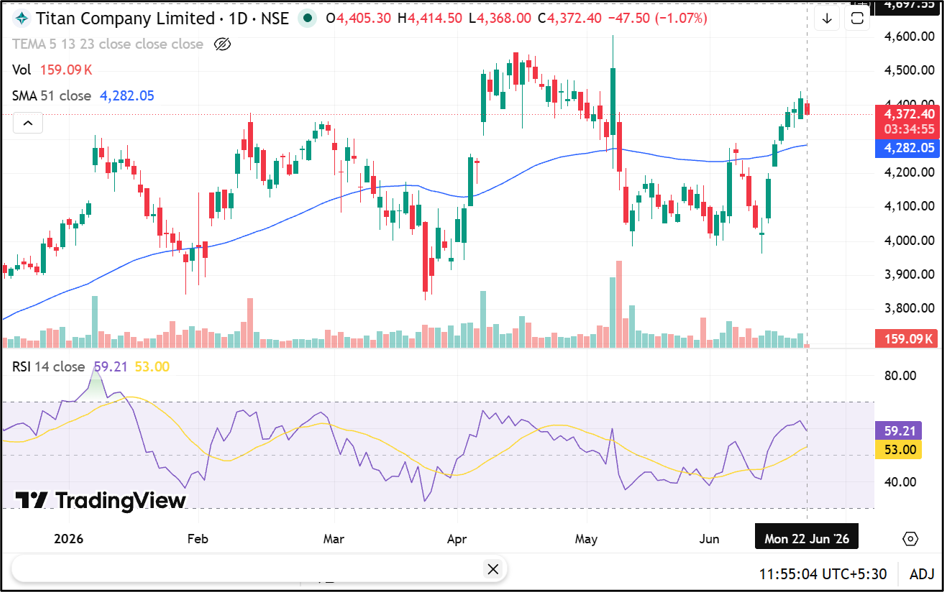
Source: TradingView
Summary
Titan Company shares fell 1.07% on June 22, 2026, amid subdued trading sentiment. The company reported consolidated total income of Rs 27,104 crore and net profit of Rs 1,179 crore for the March 2026 quarter. Despite the day's decline, the stock has outperformed the broader market across one-year, three-year and five-year periods and remains near its 52-week high.
FAQs
Q: Why did Titan Company shares fall on June 22, 2026?
A: The stock declined 1.07% during the session amid ongoing market activity and profit-booking pressure.
Q: What was Titan Company's consolidated net profit in Q4 FY26?
A: Titan reported consolidated net profit of Rs 1,179 crore for the quarter ended March 2026.
Q: How close is Titan to its 52-week high?
A: Titan currently trades about 5.0% below its 52-week high of Rs 4,605.00.