
Highlights
- Trent shares gained more than 4.5% during Wednesday's trading session.
- The company reported consolidated net profit of INR 41,310 lakh in Q4 FY26.
- The stock has delivered nearly 186% returns over the past three years.
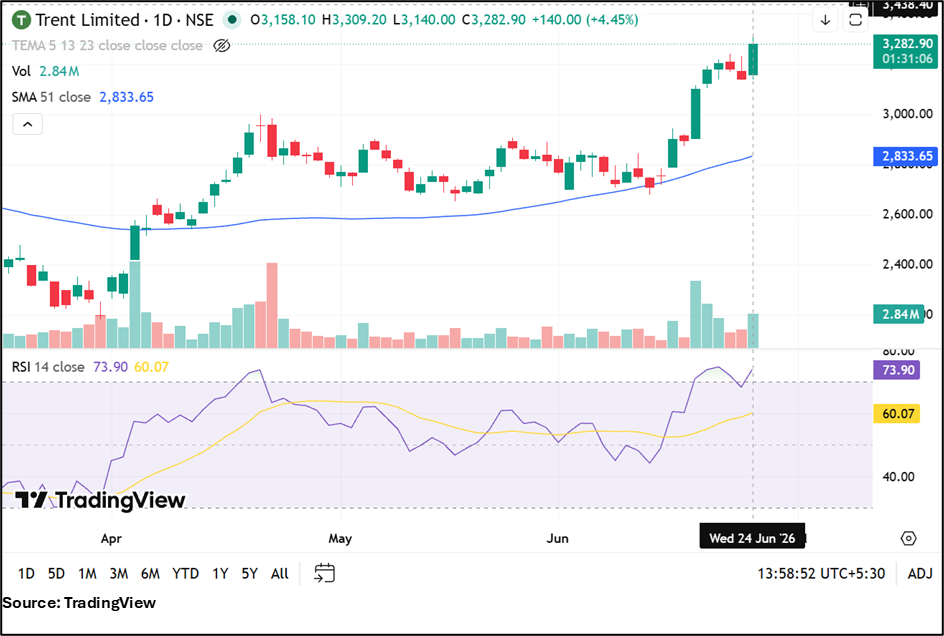
Trent Limited (NSE:TRENT), a speciality retail company and a constituent of the Nifty 50 index, witnessed strong trading activity on June 24, 2026. The stock was trading at INR 3,282.90, up 4.45% from its previous close of INR 3,142.90.
The stock opened at INR 3,158.10 and moved between an intraday low of INR 3,140.00 and a high of INR 3,309.20. Despite the day's gains, Trent remains below its 52-week high of INR 4,174.00 recorded on June 30, 2025. Based on the current market price, the stock is trading approximately 21.2% below its annual peak. The 52-week low stands at INR 2,183.67, recorded on March 30, 2026.
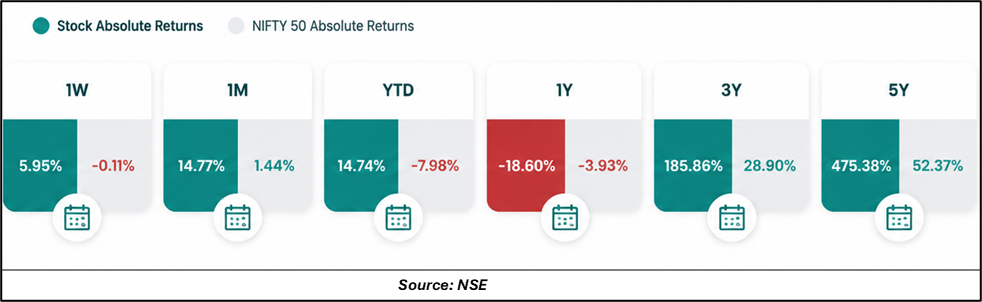
Performance Compared With Nifty 50
Trent has outperformed the Nifty 50 index across most reported periods except the one-year timeframe. During the last week, the stock gained 5.95%, compared with a decline of 0.11% in the benchmark index. Over the past month, Trent advanced 14.77%, significantly higher than the Nifty 50's gain of 1.44%.
On a year-to-date basis, the stock has risen 14.74%, while the benchmark index declined 7.98%. However, over the last year, Trent has fallen 18.60%, compared with a decline of 3.93% in the Nifty 50.
Longer-term performance remains notable. The stock has generated returns of 185.86% over three years and 475.38% over five years, substantially ahead of the benchmark returns of 28.90% and 52.37%, respectively.
Trading Volumes And Market Metrics
Trading activity remained elevated during the session, with 28.20 lakh shares changing hands. The traded value stood at INR 912.85 crore, while the volume-weighted average price (VWAP) was INR 3,237.48.
Trent currently commands a market capitalisation of INR 1,75,417.43 crore, while its free-float market capitalisation stands at INR 1,09,125.14 crore. Deliverable quantity accounted for 41.40% of total traded volume.
Q4 FY26 Earnings Snapshot
For the quarter ended March 31, 2026, Trent reported standalone total income of INR 4,99,771 lakh. Profit before tax stood at INR 57,646 lakh, while net profit came in at INR 45,475 lakh. Earnings per share (EPS) for the quarter stood at INR 12.79.
On a consolidated basis, total income was reported at INR 5,05,590 lakh. Consolidated profit before tax stood at INR 53,495 lakh, while consolidated net profit reached INR 41,310 lakh. Consolidated EPS for the quarter came in at INR 11.26.
The financial results were announced on April 22, 2026.
Valuation And Volatility Indicators
Trent is currently trading at a price-to-earnings (P/E) ratio of 97.58, while the adjusted P/E ratio stands at 96.49. Exchange data indicates that the stock's P/E ratio has remained above 50 during the previous four trailing quarters.
Daily volatility stands at 2.27%, while annualised volatility is 43.37%. The applicable margin rate is 18.17%.
Bull Case
Trent has outperformed the Nifty 50 over one week, one month, year-to-date, three-year and five-year periods. The company reported profitability in the latest quarter and remains one of the larger listed players in the speciality retail segment. Long-term shareholder returns have also exceeded benchmark performance.
Bear Case
The stock continues to trade more than 21% below its 52-week high and has underperformed the Nifty 50 over the past one year. The valuation remains elevated, with the P/E ratio close to 98. Annualised volatility above 40% also reflects significant price fluctuations.
Key Risks
- Changes in consumer spending and retail demand.
- Competitive pressures within organised retail.
- Rising operating and store expansion costs.
- Supply chain and inventory management challenges.
Today's Share Price Performance
Trent shares gained 4.45% on June 24, 2026, to trade at INR 3,282.90. The stock opened at INR 3,158.10 and climbed to an intraday high of INR 3,309.20 before easing slightly. Trading volume reached 28.20 lakh shares, while traded value stood at INR 912.85 crore. The stock remained above its previous close throughout the session and outperformed the broader benchmark index during the day.
Summary
Trent shares advanced 4.45% on June 24, 2026, amid active trading in the retail sector. The company reported consolidated net profit of INR 41,310 lakh in the March 2026 quarter. While the stock remains approximately 21.2% below its 52-week high of INR 4,174.00, it has significantly outperformed the Nifty 50 over three-year and five-year periods, delivering returns of 185.86% and 475.38%, respectively.
FAQs
Q: How far is Trent stock from its 52-week high?
A: Trent is trading approximately 21.2% below its 52-week high of INR 4,174.00.
Q: What was Trent's consolidated net profit in Q4 FY26?
A: The company reported consolidated net profit of INR 41,310 lakh for the March 2026 quarter.
Q: How has Trent performed compared with the Nifty 50?
A: Trent has outperformed the Nifty 50 across most periods except the one-year timeframe.