
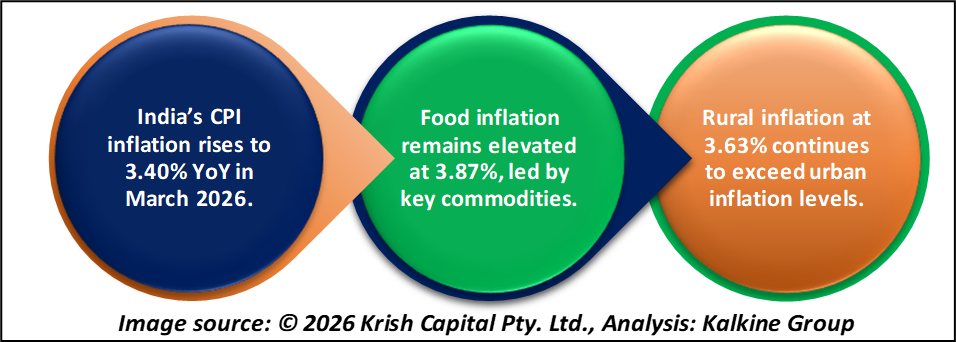
India’s retail inflation, based on the Consumer Price Index (CPI), increased to 3.40% in March 2026 compared to 3.21% in February. This shows a small rise in overall prices across the country. The inflation level is still within the central bank’s target range, but the increase indicates that price pressure has not fully eased. Rural inflation was recorded at 3.63%, which is higher than urban inflation at 3.11%, showing that price rise is stronger in rural areas.
Food Prices Continue to Impact Inflation
Food inflation played an important role in the overall increase. The Consumer Food Price Index (CFPI) rose to 3.87% in March from 3.47% in February. Prices of items like tomato, coconut, and cauliflower increased, contributing to higher inflation. However, some food items such as onion, potato, garlic, and pulses showed negative inflation, meaning their prices declined. This shows that food price trends are mixed and can change quickly.
Different Trends Across Categories
Inflation varied across different categories. Food and beverages saw inflation of 3.71%, while paan, tobacco, and intoxicants recorded 4.23%. Housing inflation remained lower at 1.97%, showing stable conditions in that segment.
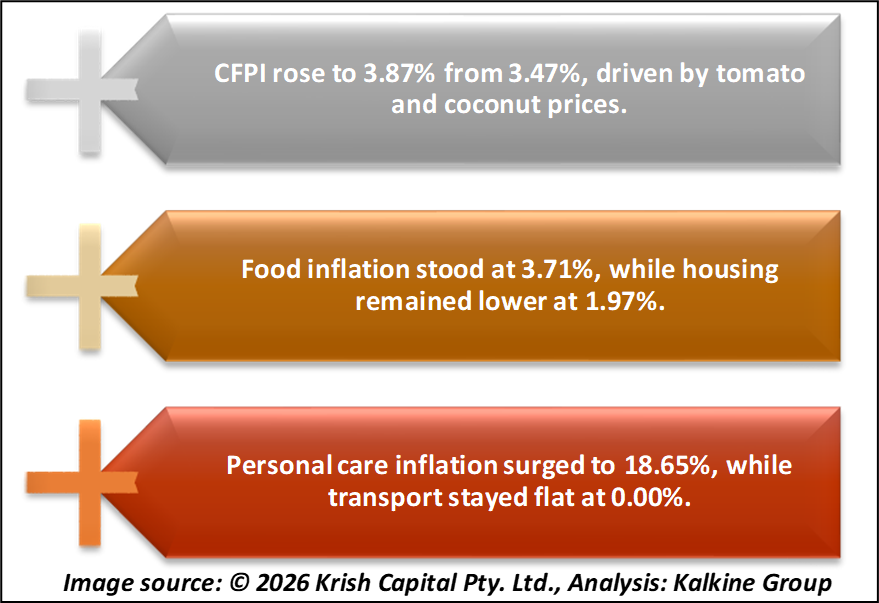
Transport inflation was almost flat at 0.00%, indicating no major change in transportation costs. A sharp increase was seen in personal care and miscellaneous goods and services, where inflation reached 18.65%, mainly due to higher prices in specific items.
High and Low Inflation Items
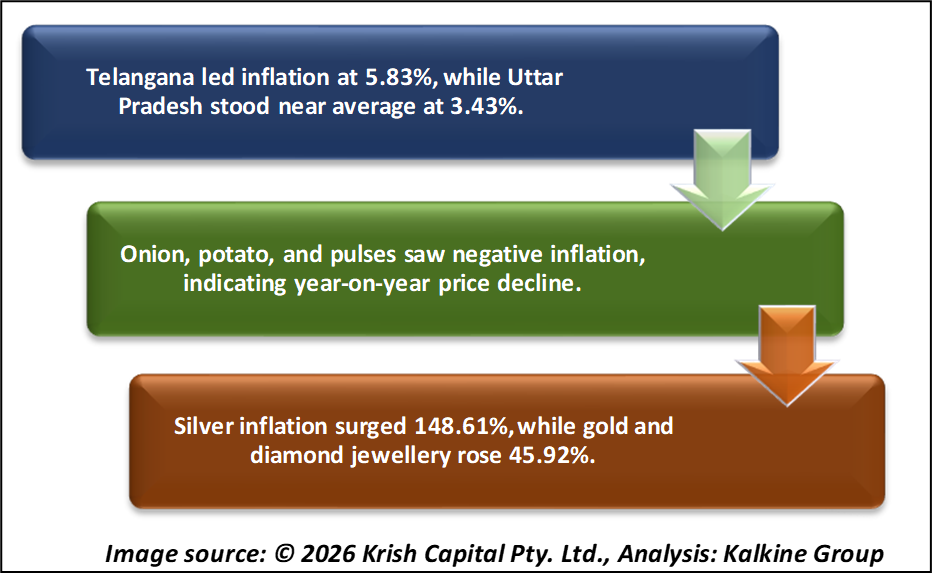
Some items recorded very high inflation in March. Silver jewellery saw extremely high inflation at 148.61%, while gold and diamond jewellery rose by 45.92%. Coconut, tomato, and cauliflower also saw high price increases. On the other hand, items like onion, potato, garlic, arhar dal, and peas recorded negative inflation, meaning prices fell compared to last year. This difference shows uneven price movement across products.
State-Wise Inflation Differences
Inflation levels also differed across states. Telangana recorded the highest inflation at 5.83%, followed by Sikkim and Andhra Pradesh. Some regions like Mizoram and Ladakh had much lower inflation levels. Uttar Pradesh recorded inflation of 3.43%, which is close to the national average. These differences show that price changes are not the same across the country.
How Data Was Collected
The inflation data is based on prices collected from 1,407 urban markets and 1,465 villages across India. The collection process had nearly full coverage, ensuring reliable data. The CPI uses base year 2024=100, and the index for March 2026 stood at 104.84. The data for March is provisional and may be revised later.
Summary
India’s CPI inflation rose to 3.40% in March 2026, mainly due to higher food prices. Food inflation increased to 3.87%, while rural inflation remained higher than urban. Price trends were mixed across categories and states. While inflation is still within the target range, the data shows that price pressures remain and may influence consumption and economic trends going forward.
FAQs
- What is India’s inflation rate for March 2026?
India’s CPI inflation rate for March 2026 is 3.40%, slightly higher than the February level of 3.21%. - Why did inflation increase in March 2026?
Inflation increased mainly due to higher food prices, especially vegetables and some essential commodities. - Which areas have higher inflation, rural or urban?
Rural areas have higher inflation at 3.63% compared to urban areas at 3.11%.