
Highlights
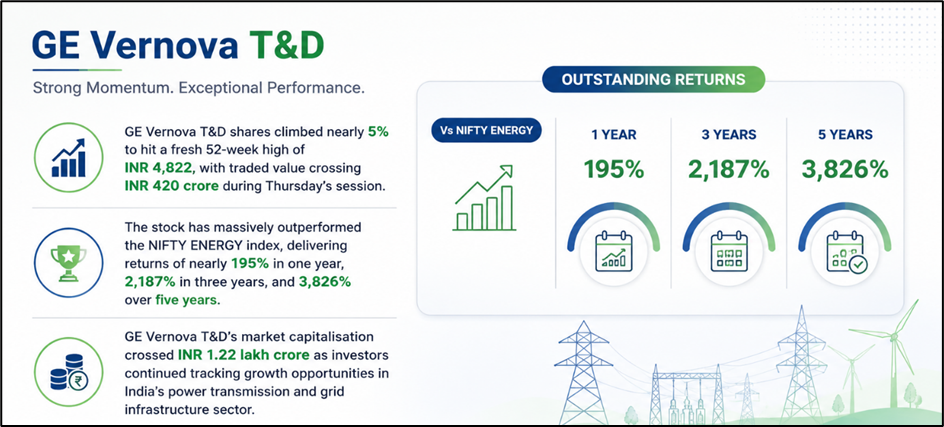
- GE Vernova T&D India Limited shares gained nearly 5 percent during Thursday’s trading session.
- The stock touched a fresh 52-week high of INR 4,822 on May 7.
- GE Vernova T&D delivered over 194 percent returns in the last one year.
Shares of GE Vernova T&D India Limited (NSE:GVT&D) rose 4.73 percent on May 7, 2026, continuing their upward momentum on the National Stock Exchange.
The stock traded at INR 4,779 during the afternoon session, compared with the previous close of INR 4,563.10. The stock opened at INR 4,586 and touched an intraday high of INR 4,822, marking a fresh 52-week high. The day’s low remained at INR 4,580, while VWAP stood at INR 4,735.16.
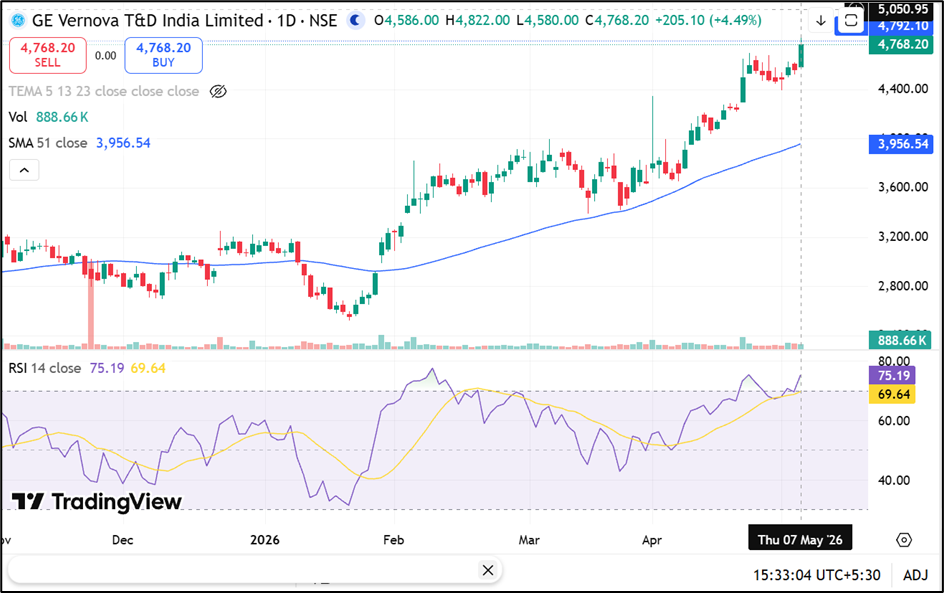
Source: TradingView
Trading Volumes and Market Capitalisation
During Thursday’s trading session, traded volume stood at 8.88 lakh shares, while traded value reached INR 420.54 crore.
The company’s total market capitalisation was reported at INR 1,22,364.64 crore. Free float market capitalisation stood at INR 59,064.20 crore.
Deliverable quantity as a percentage of traded quantity stood at 50.73 percent. The applicable margin rate remained at 100 percent.
Business Operations and Sector Presence
GE Vernova T&D India Limited operates in the power transmission and distribution segment and represents GE’s Grid Solutions business in India.
The company has operated in India’s transmission and distribution sector for more than 100 years and provides solutions related to power evacuation, grid connectivity, and transmission infrastructure.
Its operations support power transmission from generation sources to the electricity grid across multiple utility and industrial applications.
Source: NSE
Strong Outperformance Against NIFTY ENERGY
GE Vernova T&D shares significantly outperformed the NIFTY ENERGY index across multiple periods. Over the last one week, the stock gained 7 percent compared with 0.95 percent rise in the benchmark energy index.
On a one-month basis, the stock advanced 30.10 percent, while the NIFTY ENERGY index gained 15.69 percent. Year-to-date, the stock climbed 51.02 percent against 15.92 percent gains in the benchmark.
Over the last one year, GE Vernova T&D generated returns of 194.67 percent, substantially higher than the 20.89 percent return delivered by the NIFTY ENERGY index.
The stock also delivered 2,187.15 percent returns over three years and 3,826.87 percent returns over five years.
Stock Volatility and Price Indicators
The stock recorded daily volatility of 2.73 percent, while annualised volatility stood at 52.16 percent.
GE Vernova T&D shares currently trade within a 20 percent price band, with the upper band at INR 5,475.70 and the lower band at INR 3,650.50. The stock’s tick size remains INR 0.10.
Key Risks Investors Should Track
- Capital-intensive projects may increase execution and operational risks.
- Delays in power sector spending could affect order inflows.
- High volatility may lead to sharp short-term stock price movements.
- Regulatory and policy changes may impact transmission sector investments.
Summary
GE Vernova (NSE:GVT&D) shares rose 4.73 percent on May 7, 2026, touching a fresh 52-week high of INR 4,822 during intraday trading. The stock has significantly outperformed the NIFTY ENERGY index across one-year, three-year, and five-year periods. The company operates in India’s power transmission and distribution sector through its grid solutions business and supports power evacuation and grid connectivity infrastructure.
FAQs
Q: Why did GE Vernova T&D shares rise on May 7, 2026?
A: The stock gained amid continued momentum and touched a fresh 52-week high during trading.
Q: What was GE Vernova T&D’s 52-week high price?
A: GE Vernova T&D shares touched a fresh 52-week high of INR 4,822 on NSE.
Q: How much return has GE Vernova T&D delivered in one year?
A: The stock generated approximately 194.67 percent returns over the last one-year period.