
Highlights
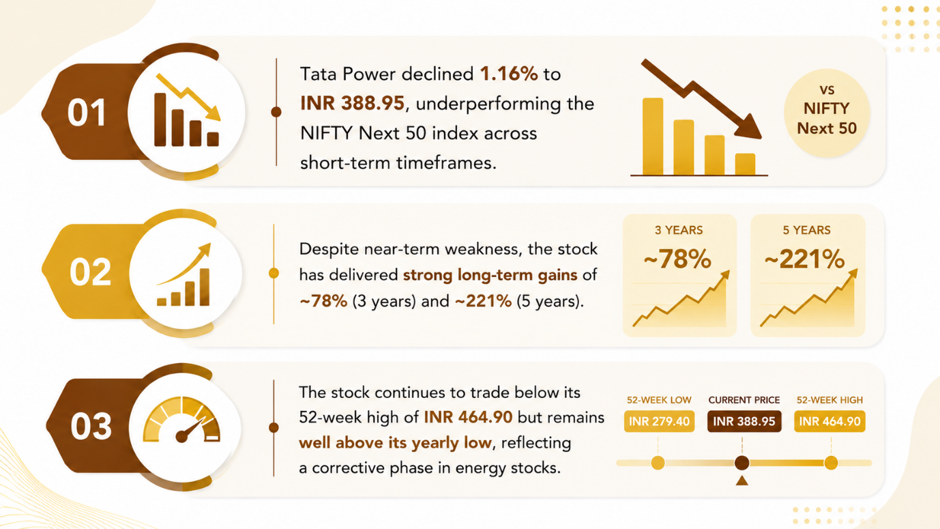
- Tata Power shares declined 1.16% to close at INR 388.95 in latest session.
- Company remains above key long-term returns despite short-term weakness.
- Stock trades below its 52-week high of INR 464.90 after recent correction phase.
Tata Power Company Limited, listed on the National Stock Exchange (NSE:TATAPOWER) under the integrated power utilities segment, closed at INR 388.95 on June 25, 2026, marking a decline of INR 4.15 or 1.06% from the previous close.
The stock opened at INR 395.05 and moved within a range of INR 395.90 to INR 388.00 during the trading session. The Volume Weighted Average Price (VWAP) stood at INR 391.70, slightly above the closing price.
Source: Analysis by Kalkine
Trading Activity and Market Position
Tata Power recorded traded volume of 63.92 lakh shares with a traded value of INR 250.36 crore during the session. The impact cost remained low at 0.03, indicating efficient liquidity in the counter.
The company’s total market capitalisation stood at INR 1,24,154.92 crore, while free-float market capitalisation was INR 64,864.49 crore. Deliverable quantity accounted for 53.24% of total traded volume, reflecting balanced participation between delivery and intraday trading activity.
Stock Performance Across Time Frames
Tata Power has shown mixed performance relative to the NIFTY Next 50 index.
Over the past week, the stock declined 3.43%, underperforming the index, which fell 0.22%. On a one-month basis, Tata Power declined 7.70% versus the index gain of 1.77%.
Year-to-date performance shows a modest gain of 1.75%, compared with 3.62% for the index, indicating slight underperformance.
Over a one-year period, the stock declined 4.22%, while the index gained 5.72%.
Longer-term performance remains stronger, with gains of 77.74% over three years and 220.85% over five years.
The stock is currently trading below its 52-week high of INR 464.90 (28-Apr-2026) but above its 52-week low of INR 342.50 (27-Jan-2026).
Financial Performance Overview
For the quarter ended March 31, 2026, Tata Power reported standalone total income of INR 36,66,221.00 lakh (as per exchange filing format not detailed here in segment breakdown).
Profitability trends reflect continued operations in the integrated power utility segment, with earnings influenced by generation, distribution, and renewable energy contributions.
Valuation and Market Position
Tata Power is part of the NIFTY Next 50 index and operates in the Integrated Power Utilities sector. The stock’s P/E ratio stands at 28.18, with adjusted P/E at 27.91.
The stock shows moderate volatility at 29.99 annualised, in line with utility sector stability compared to broader market indices.
Key Risks
- Regulatory changes in power tariffs may impact revenue stability.
- Fuel cost fluctuations can affect generation margins.
- High capital expenditure in renewables may pressure cash flows.
- Demand variability in industrial consumption affects earnings cycles.
Summary
Tata Power Company Limited closed lower at INR 388.95 on June 25, 2026, amid sector-wide weakness in energy counters. Despite short-term decline, the stock maintains strong long-term returns and continues to trade significantly above its 52-week low.
FAQs
Q: What was Tata Power’s closing price on June 25, 2026?
A: Tata Power closed at INR 388.95 after a decline of 1.16% in the session.
Q: How has Tata Power performed over the long term?
A: Tata Power delivered strong gains of 220.85% over five years and 77.74% over three years.
Q: Is Tata Power trading near its 52-week high?
A: No, the stock is currently below its 52-week high of INR 464.90.