
Highlights
- Oil India shares gained almost 6% during Tuesday’s NSE trading session.
- The stock traded near its 52-week high amid increased investor participation.
- Oil India market capitalisation crossed INR 78,500 crore during the session.
Oil India Limited (NSE:OIL) shares moved higher during the May 12 trading session on the National Stock Exchange. The stock was trading at INR 485.05 at 10:04 IST, up 6.37% from the previous close of INR 456.00.
The stock opened at INR 472.00 and touched an intraday high of INR 490.80. The day’s low was recorded at INR 471.65, indicating sustained buying activity during the morning trade. Oil India shares were also trading closer to their 52-week high of INR 524.00 touched on February 4, 2026.
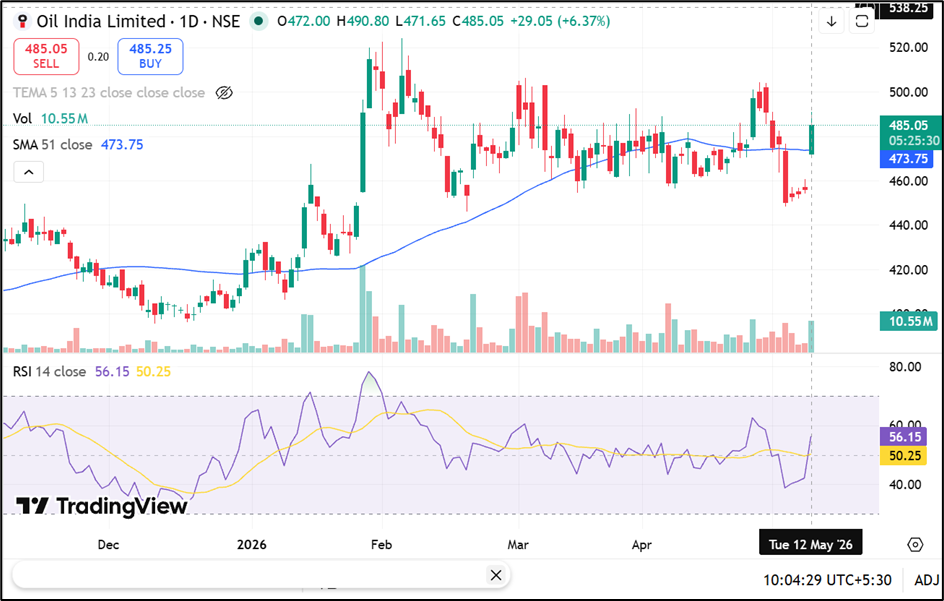
Source: TradingView
Trading Volumes and Market Activity
The counter witnessed traded volume of 100.68 lakh shares during the session. Traded value stood at INR 487.34 crore, reflecting active market participation in the stock.
The company’s total market capitalisation was INR 78,589.56 crore, while free float market capitalisation stood at INR 26,289.18 crore. The stock’s VWAP during the session was INR 484.09.
The deliverable quantity as a percentage of traded quantity stood at 29.55%, while the impact cost remained at 0.04.
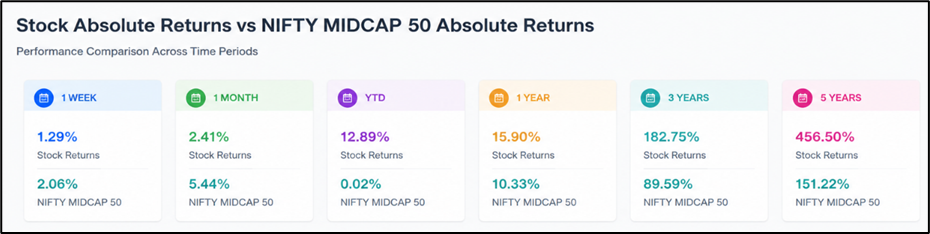
Performance Against Benchmark Index
Oil India shares have delivered gains across multiple timeframes compared with the NIFTY MIDCAP 50 index.
On a year-to-date basis, the stock gained 12.89%, while the benchmark index recorded 0.02% returns. Over a one-year period, Oil India shares advanced 15.90%, compared with 10.33% gains in the NIFTY MIDCAP 50 index.
The stock generated returns of 182.75% over three years and 456.50% over five years, outperforming the benchmark index during both periods.
In shorter durations, Oil India gained 1.29% over one week and 2.41% over one month.
Source: NSE
Volatility and Price Details
Oil India’s annualised volatility stood at 41.65%, while daily volatility was recorded at 2.18. The stock’s 52-week low was INR 384.60, touched on August 29, 2025.
The applicable margin rate for the stock was 17.44, while the face value remained INR 10 per share.
According to the company profile, Oil India operates in crude oil and natural gas exploration, development, production, crude transportation, LPG production, and E&P-related services.
Key Risks Investors Monitor
- Crude oil price fluctuations may affect revenue visibility.
- Regulatory changes can impact operational and pricing structures.
- Exploration activities carry production and reserve-related uncertainties.
- Global energy demand shifts may influence sector performance.
Summary
Oil India (NSE:OIL) shares advanced nearly 6% during Tuesday’s NSE trading session amid increased trading volumes and investor activity. The stock traded near its 52-week high and outperformed the NIFTY MIDCAP 50 index across longer-term periods.
Oil India continues to operate across crude oil exploration, natural gas production, transportation, and LPG segments while market participants monitor commodity prices and sector developments.
FAQs
Q: What was Oil India’s share price on May 12, 2026?
A: Oil India shares traded at INR 483.30, rising 5.99% during the NSE session.
Q: What is Oil India’s 52-week high level?
A: The stock’s 52-week high was INR 524.00, recorded on February 4, 2026.
Q: How has Oil India performed against NIFTY MIDCAP 50?
A: Oil India outperformed the benchmark across year-to-date, three-year, and five-year return periods.