
Highlights
- ONGC shares gained nearly 4% during Tuesday’s NSE trading session.
- The stock traded close to its 52-week high amid active market participation.
- ONGC market capitalisation crossed INR 3.67 lakh crore during the session.
Oil and Natural Gas Corporation Limited (NSE:ONGC) shares moved higher during the May 12 trading session on the National Stock Exchange. The stock was trading at INR 291.50 at 09:45 IST, up 3.74% from the previous close of INR 281.00.
The stock opened at INR 286.90 and touched an intraday high of INR 295.50. The day’s low stood at INR 286.85, indicating positive momentum during early trade. ONGC shares were also trading near their 52-week high of INR 307.50 recorded on April 29, 2026.
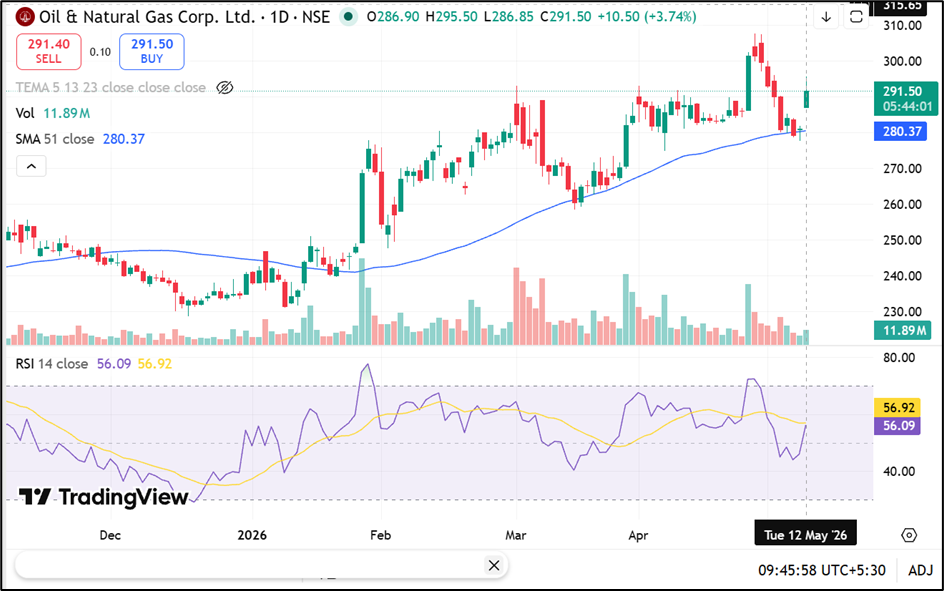
Source: TradingView
Trading Volumes and Market Capitalisation
ONGC witnessed traded volume of 114.80 lakh shares during the session. The traded value stood at INR 335.87 crore, reflecting notable market activity in the counter.
The company’s total market capitalisation was reported at INR 3,67,407.05 crore, while free float market capitalisation stood at INR 1,13,188.98 crore. The stock’s VWAP was recorded at INR 292.58.
The deliverable quantity as a percentage of traded quantity was 35.36%, while the impact cost remained at 0.02.
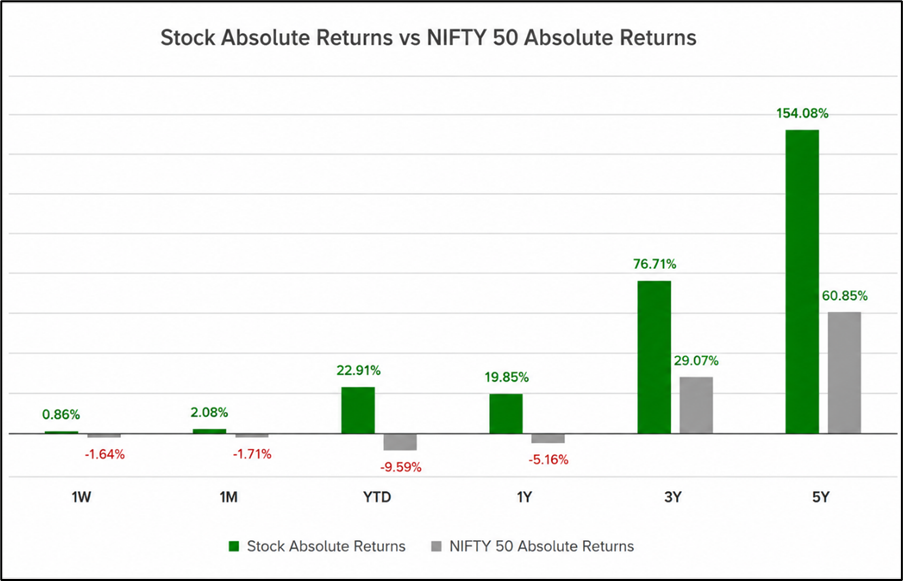
Stock Performance Across Timeframes
ONGC shares have outperformed the benchmark NIFTY 50 index across multiple periods. The stock delivered returns of 22.91% on a year-to-date basis, compared with a decline of 9.59% in the NIFTY 50 index.
Over a one-year period, ONGC shares gained 19.85%, while the benchmark index declined 5.16%. The stock has also generated returns of 76.71% over three years and 154.08% over five years.
Source: NSE
Volatility and Price Range
The stock’s annualised volatility stood at 31.91%, while daily volatility was recorded at 1.67. ONGC’s 52-week low was INR 228.61, touched on December 17, 2025.
The applicable margin rate for the stock was 14.06, while the face value remained INR 5 per share.
According to the company profile, ONGC contributes around 71% of India’s domestic crude oil and natural gas production.
Key Risks Investors Track
- Crude oil price fluctuations may affect earnings visibility.
- Changes in government policies can impact energy sector operations.
- Currency volatility may influence import-linked operational costs.
- Exploration and production risks remain linked to output uncertainties.
Summary
ONGC (NSE:ONGC) shares advanced nearly 4% during Tuesday’s trading session on NSE, supported by active trading volumes and broader investor interest in energy counters. The stock traded near its 52-week high and outperformed benchmark indices across several timeframes. ONGC remains one of India’s largest oil and natural gas producers, with market participants monitoring commodity prices, policy developments, and operational performance.
FAQs
Q: What was ONGC’s share price on May 12, 2026?
A: ONGC shares traded at INR 292.10, rising 3.95% during the NSE trading session.
Q: What is ONGC’s 52-week high level?
A: The stock’s 52-week high was INR 307.50, recorded on April 29, 2026.
Q: How has ONGC performed against NIFTY 50 recently?
A: ONGC outperformed NIFTY 50 across one-year, three-year, and five-year return periods.