
Highlights
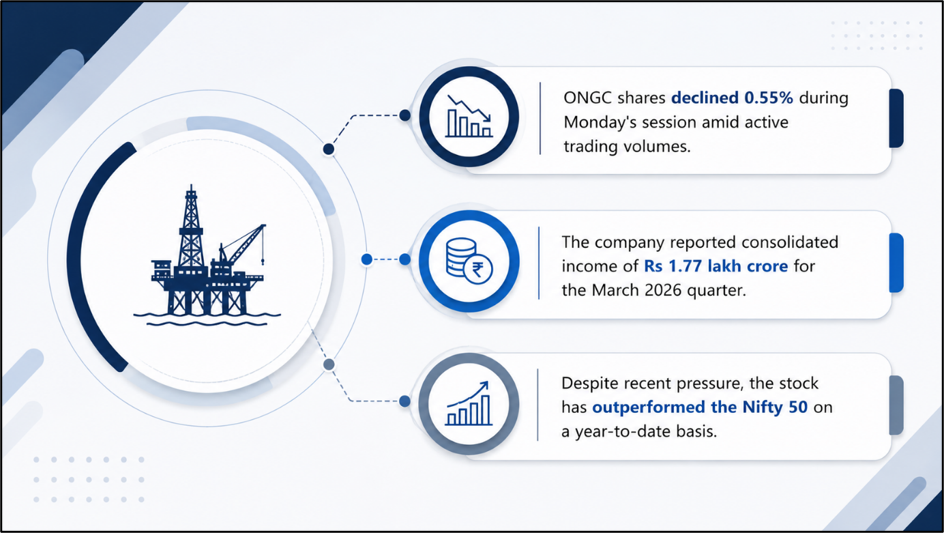
- ONGC shares declined 0.55% during Monday's trading session.
- The stock traded near Rs 245 while remaining below its 52-week high.
- Consolidated net profit stood at Rs 13,678 crore in Q4 FY26.
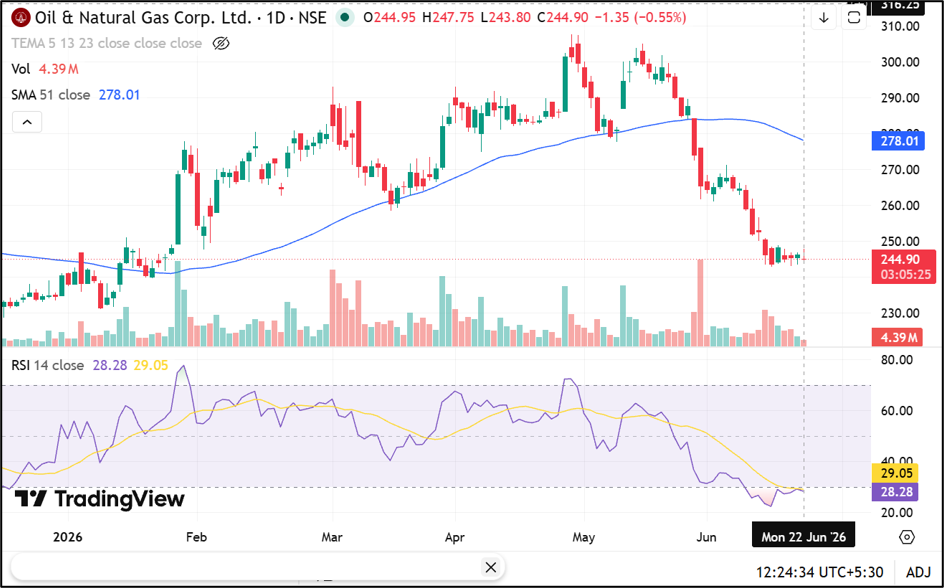
Oil and Natural Gas Corporation Limited (NSE:ONGC) shares traded lower on June 22, 2026, with the stock declining 0.55% to Rs 244.90. The share price was down Rs 1.40 from the previous close of Rs 246.25. The stock opened at Rs 244.95 and touched an intraday high of Rs 247.75. During the session, it also recorded a low of Rs 243.80.
Trading activity remained active, with 43.38 lakh shares changing hands. The traded value stood at Rs 106.87 crore, while the volume-weighted average price (VWAP) was Rs 246.33.
Source: Analysis by Kalkine
Q4 FY26 Financial Performance
For the quarter ended March 31, 2026, ONGC reported consolidated total income of Rs 1,77,173 crore. Profit before tax stood at Rs 15,847 crore, while net profit came in at Rs 13,678 crore. Consolidated earnings per share for the quarter stood at Rs 8.60.
On a standalone basis, the company reported total income of Rs 38,556 crore. Profit before tax stood at Rs 8,524 crore, while net profit was Rs 6,650 crore. Standalone earnings per share came in at Rs 5.29. The company announced its quarterly results on May 26, 2026.
Market Capitalisation And Valuation
ONGC has a market capitalisation of approximately Rs 3.08 lakh crore, while its free-float market capitalisation stands at Rs 94,828 crore. The stock currently trades at a price-to-earnings ratio of 6.62, while the adjusted P/E ratio stands at 6.58.
ONGC is a constituent of the Nifty 50 index and operates in the Oil Exploration and Production sector. The company has been listed on Indian stock exchanges since July 19, 1995.
Return Performance Across Timeframes
ONGC has delivered mixed returns across different periods. Over the last week, the stock gained 0.49%, compared with a 1.12% rise in the Nifty 50. During the past month, ONGC declined 15.57%, while the benchmark index gained 1.70%.
On a year-to-date basis, the stock has risen 2.90%, outperforming the Nifty 50, which has declined 7.74%. The one-year return stands at negative 2.79%. However, ONGC has generated returns of 54.04% over three years and 100.61% over five years, ahead of the benchmark's performance during those periods.
Trading Range And Volatility Indicators
ONGC touched its 52-week high of Rs 307.50 on April 29, 2026, while the 52-week low of Rs 228.61 was recorded on December 17, 2025.
The stock currently trades without any price band restrictions. Daily volatility stands at 1.70%, while annualised volatility is reported at 32.48%. The impact cost of 0.02 indicates relatively liquid trading conditions.
Business Overview
Oil and Natural Gas Corporation Limited is engaged in the exploration, development and production of crude oil and natural gas. The company operates across upstream energy activities and is one of India's major oil and gas producers.
ONGC's operations include exploration and production assets across onshore and offshore fields, contributing to domestic hydrocarbon production.
Key Risks To Watch
- Crude oil price fluctuations may impact profitability.
- Production disruptions can affect output volumes.
- Regulatory changes may influence sector economics.
- Exploration risks may impact reserve additions.
Today's Share Performance
ONGC shares traded lower on June 22, 2026, falling 0.55% to Rs 244.90 during afternoon trade. The stock moved between Rs 243.80 and Rs 247.75 after opening at Rs 244.95.
Trading volume reached 43.38 lakh shares, while turnover stood at Rs 106.87 crore. At the current market price, ONGC trades approximately 20.4% below its 52-week high of Rs 307.50 and about 7.1% above its 52-week low of Rs 228.61.
Source: TradingView
Summary
ONGC (NSE:ONGC) shares declined 0.55% on June 22, 2026, amid active trading activity. The company reported consolidated total income of Rs 1,77,173 crore and net profit of Rs 13,678 crore for the March 2026 quarter. While the stock has come under pressure over the past month, it has outperformed the Nifty 50 on a year-to-date basis and delivered strong returns over three-year and five-year periods.
FAQs
Q: Why did ONGC shares fall on June 22, 2026?
A: ONGC shares declined 0.55% during the session amid regular market movements and trading activity.
Q: What was ONGC's consolidated net profit in Q4 FY26?
A: ONGC reported consolidated net profit of Rs 13,678 crore for the quarter ended March 2026.
Q: How far is ONGC from its 52-week high?
A: The stock currently trades about 20.4% below its 52-week high of Rs 307.50.