
Highlights
- Jindal Drilling shares surged nearly 13% during Tuesday’s NSE trading session.
- The stock entered the list of top gainers amid increased trading activity.
- Jindal Drilling market capitalisation crossed ₹ 1,700 crore during trade.
Jindal Drilling And Industries Limited (NSE:JINDRILL) shares rallied during the May 12 session on the National Stock Exchange. The stock was trading at ₹ 600.95 up 13.30% from the previous close of ₹ 530.40.
The stock opened at ₹ 533.90 and climbed to an intraday high of ₹ 599.20. The session low remained at ₹ 531.30, reflecting strong upward momentum during trade.
Jindal Drilling shares were also among the top gainers during the session and continued trading below their 52-week high of ₹ 759.90 recorded on May 27, 2025.
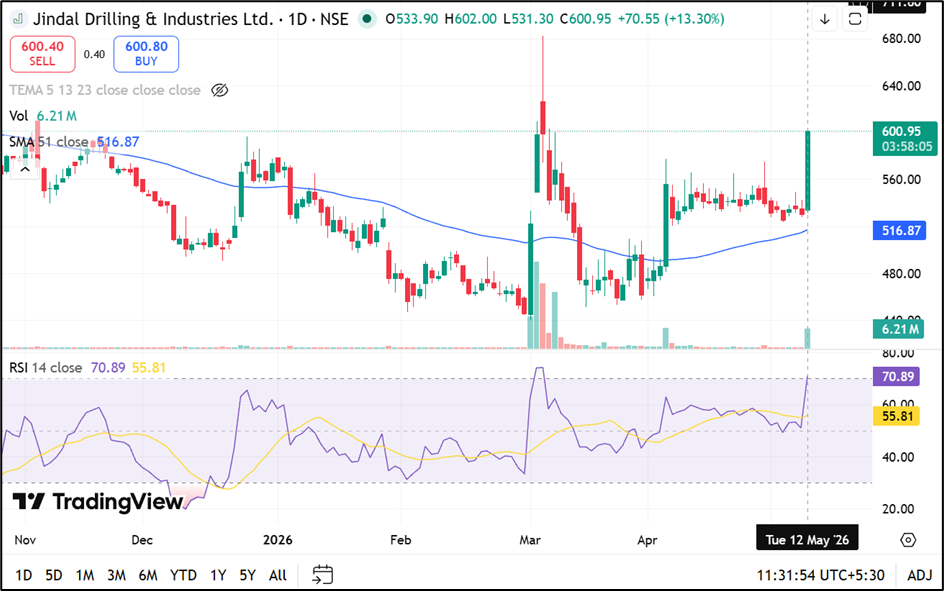
Source: TradingView
Trading Volumes and Market Capitalisation
The stock recorded traded volume of 59.19 lakh shares during the session, while traded value stood at ₹ 346.12 crore.
The company’s total market capitalisation stood at ₹ 1,734.81 crore, while free float market capitalisation was ₹ 577.01 crore. The VWAP during the session was ₹ 584.51.
Deliverable quantity as a percentage of traded quantity stood at 17.03%, while the impact cost remained at 0.11.
Performance Compared With NIFTY 50
Jindal Drilling shares outperformed the NIFTY 50 index across multiple periods.
The stock gained 11.81% over one week and 11.23% over one month, while the benchmark NIFTY 50 index declined during both periods.
On a year-to-date basis, the stock advanced 5.43%, compared with a 9.74% decline in the NIFTY 50 index.
Over three years, Jindal Drilling shares delivered returns of 113.88%, while five-year returns stood at 433.26%, outperforming the benchmark index during both periods.
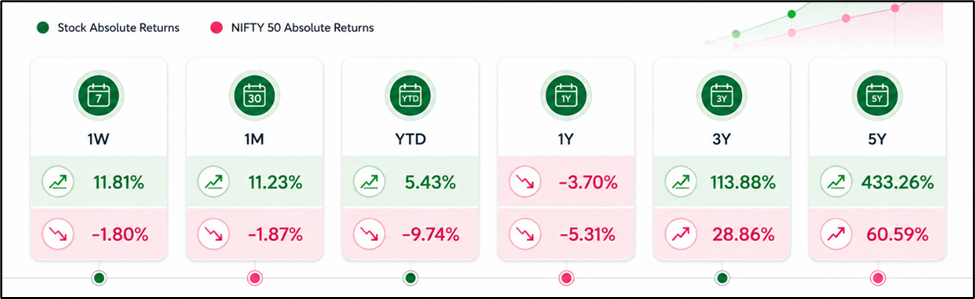
Source: NSE
Volatility and Business Overview
The stock recorded annualised volatility of 61.14%, while daily volatility stood at 3.20, indicating elevated price movement during trading sessions.
The stock touched its 52-week low of ₹ 440.10 on March 2, 2026. The applicable margin rate stood at 25.14%, while the face value remained ₹ 5 per share.
According to the company profile, Jindal Drilling & Industries operates in offshore drilling and allied services, including directional drilling and mud logging activities.
Key Risks Investors Monitor
- Crude oil price fluctuations may affect offshore drilling demand.
- High volatility can increase short-term stock price movement.
- Energy sector capital expenditure cycles may impact operations.
- Lower deliverable volumes may reflect elevated trading activity.
Summary
Jindal Drilling (NSE:JINDRILL) shares surged nearly 13% during Tuesday’s NSE session and entered the list of top gainers amid heavy trading activity. The stock outperformed the benchmark index across multiple periods despite remaining below its 52-week high. Investors continue monitoring energy sector trends, offshore drilling demand, crude oil prices, and broader market volatility affecting the stock.
FAQs
Q: What was Jindal Drilling share price on May 12, 2026?
A: Jindal Drilling shares traded at ₹ 599.05, up 12.94% during the NSE session.
Q: What is the 52-week high level of Jindal Drilling shares?
A: The stock’s 52-week high was ₹ 759.90, recorded on May 27, 2025.
Q: Why was Jindal Drilling among top gainers today?
A: The stock witnessed sharp price gains alongside increased trading volumes during the session.