
Highlights
- Reliance Industries shares gained 0.80% during Wednesday's trading session.
- The company reported consolidated net profit of INR 20,58,900 lakh in Q4 FY26.
- The stock remains nearly 18% below its 52-week high level.
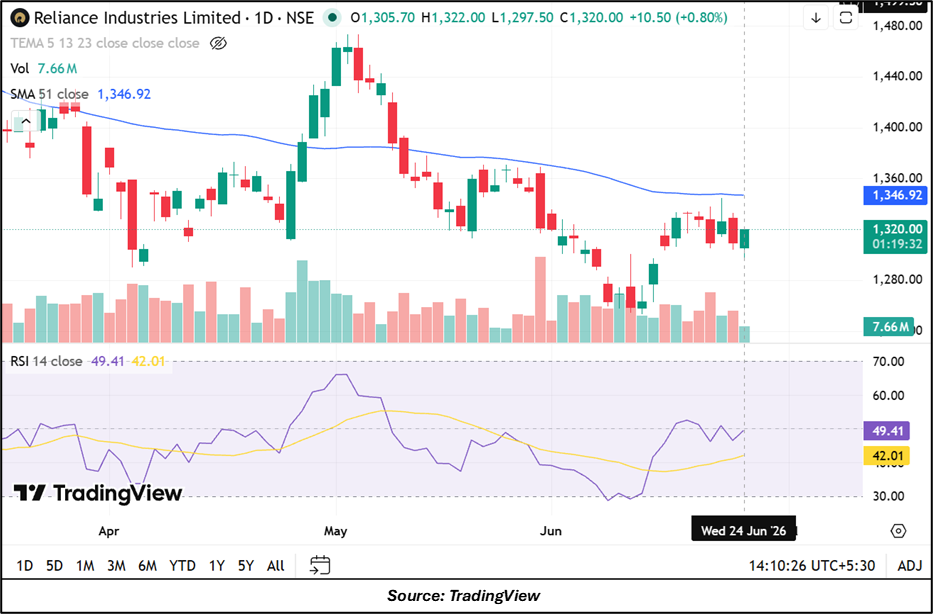
Reliance Industries Limited (NSE:RELIANCE), one of India's largest listed companies by market capitalisation, remained in focus on June 24, 2026. The stock was trading at INR 1,320.00, up 0.80% from its previous close of INR 1,309.50.
The stock opened at INR 1,305.70 and traded between an intraday low of INR 1,297.50 and a high of INR 1,322.00. Exchange data also indicated activity in Block Deal Session 1 during the day.
Despite the gain, Reliance Industries remains below its 52-week high of INR 1,611.80 recorded on January 5, 2026. Based on the current market price, the stock is trading approximately 18.2% below its annual peak. The 52-week low stands at INR 1,253.20, recorded on June 11, 2026.
The company is part of the Nifty 50 index and operates within the refineries and marketing segment, while also having interests across multiple business verticals.
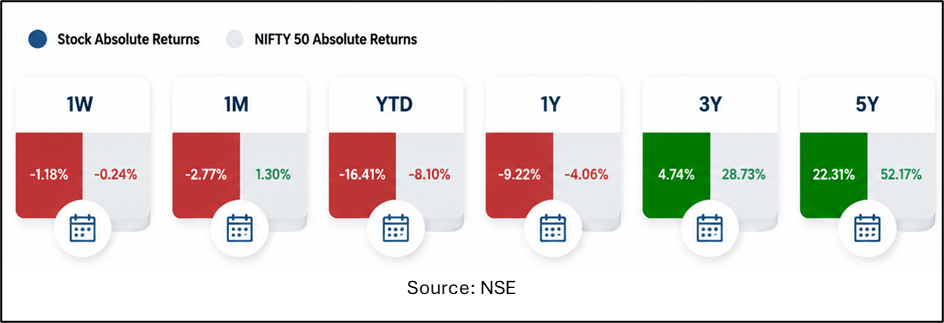
Stock Underperforms Nifty 50 Across Timeframes
Reliance Industries has underperformed the Nifty 50 index across all reported return periods. During the last week, the stock declined 1.18%, compared with a 0.24% decline in the benchmark index. Over the past month, Reliance Industries fell 2.77%, while the Nifty 50 gained 1.30%. On a year-to-date basis, the stock has declined 16.41%, compared with an 8.10% decline in the benchmark.
The one-year return stands at negative 9.22%, compared with a decline of 4.06% in the Nifty 50. Over three years, the stock has gained 4.74%, trailing the benchmark return of 28.73%. The five-year return stands at 22.31%, significantly below the Nifty 50's return of 52.17% during the same period.
Q4 FY26 Financial Performance
For the quarter ended March 31, 2026, Reliance Industries reported consolidated total income of INR 3,03,06,800 lakh. Profit before tax stood at INR 27,19,500 lakh, while consolidated net profit came in at INR 20,58,900 lakh. Earnings per share (EPS) for the quarter was INR 12.54.
On a standalone basis, total income stood at INR 1,49,74,200 lakh. Profit before tax was INR 9,78,300 lakh, while net profit reached INR 7,42,200 lakh. Standalone EPS stood at INR 5.48.
The financial results were announced on April 24, 2026.
Trading Activity And Valuation Metrics
Reliance Industries recorded trading volume of 75.34 lakh shares during the session, while traded value stood at INR 987.24 crore. The stock's volume-weighted average price (VWAP) was INR 1,310.43.
The company currently has a market capitalisation of INR 17,82,370.68 crore, making it among the largest listed companies in India. Free-float market capitalisation stands at INR 8,87,059.52 crore.
Reliance Industries trades at a price-to-earnings (P/E) ratio of 18.53. Daily volatility is reported at 1.38%, while annualised volatility stands at 26.36%.
Bull Case
Reliance Industries reported consolidated net profit of INR 20,58,900 lakh in Q4 FY26 and maintains one of the largest market capitalisations in the Indian market. The stock trades at a P/E ratio of 18.53, lower than several high-growth sectors, and remains a key constituent of the Nifty 50 index.
Bear Case
The stock has underperformed the Nifty 50 across one week, one month, year-to-date, one-year, three-year and five-year periods. It also remains more than 18% below its 52-week high, indicating that it has yet to recover to earlier peak levels.
Key Risks
- Fluctuations in crude oil and refining margins.
- Regulatory changes affecting energy and telecom businesses.
- Slowdown in consumer and retail demand.
- Capital-intensive expansion and execution challenges.
Today's Share Price Performance
Reliance Industries shares gained 0.80% on June 24, 2026, to trade at INR 1,320.00. The stock opened at INR 1,305.70 and touched an intraday high of INR 1,322.00 before moderating slightly. Trading volume stood at 75.34 lakh shares, while traded value reached INR 987.24 crore. The stock remained above its previous close during the session but continued to trade below its 52-week high level.
Summary
Reliance Industries shares traded 0.80% higher at INR 1,320.00 on June 24, 2026. The company reported consolidated net profit of INR 20,58,900 lakh in the March 2026 quarter and continues to rank among India's largest listed companies by market capitalisation. However, the stock remains approximately 18.2% below its 52-week high of INR 1,611.80 and has underperformed the Nifty 50 across major return periods.
FAQs
Q: How far is Reliance Industries from its 52-week high?
A: The stock is trading approximately 18.2% below its 52-week high of INR 1,611.80.
Q: What was Reliance Industries' consolidated net profit in Q4 FY26?
A: The company reported consolidated net profit of INR 20,58,900 lakh for the March 2026 quarter.
Q: How has Reliance Industries performed compared with the Nifty 50?
A: The stock has underperformed the Nifty 50 across all reported return periods.