

Highlights
- HDFC Bank shares declined 2% during May 27 trading session on NSE.
- The stock remained significantly below its 52-week high recorded in October 2025.
- HDFC Bank underperformed the NIFTY 50 across most longer-term return periods.
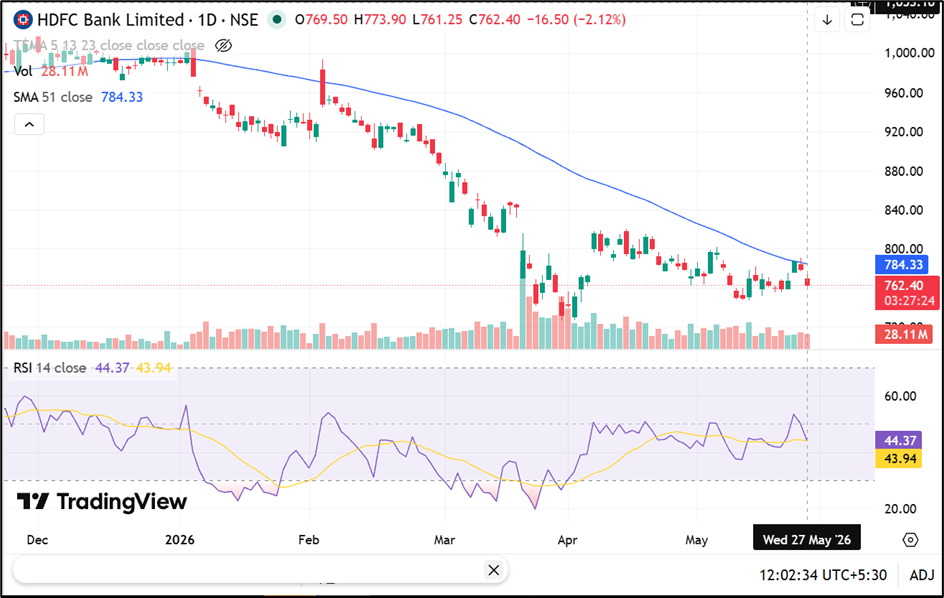
HDFC Bank Limited (NSE:HDFCBANK) shares traded lower on May 27, 2026, with the stock falling 2.12% to INR 762.40 during intraday trade on the NSE. The stock opened at INR 769.50 and touched an intraday high of INR 773.90, while the session low stood at INR 761.25.
The banking major witnessed heavy trading activity during the session. Around 276.66 lakh shares changed hands, translating into a traded value of approximately INR 2,118 crore. The stock recorded a VWAP of INR 765.62.
Source: TradingView
Stock Trades Below 52-Week High
HDFC Bank shares continued to trade well below their 52-week high of INR 1,020.50 touched in October 2025. However, the stock remained above its 52-week low of INR 726.65 recorded in April 2026.
The company’s total market capitalisation stood at INR 11.75 lakh crore, while free float market capitalisation was reported at INR 11.66 lakh crore. Deliverable quantity accounted for 58.82% of traded volume during the session.
Returns Lag Benchmark Index
HDFC Bank Limited underperformed the benchmark NIFTY 50 index across several timeframes. The stock declined 23.01% on a year-to-date basis compared to an 8.46% fall in the NIFTY 50.
Over the last one year, HDFC Bank shares fell 20.77%, while the benchmark index declined 3.60%. During the last three years, the stock generated negative returns of 5.55% compared with gains of 29.37% in the NIFTY 50.
On a five-year basis, HDFC Bank delivered returns of 2.94%, while the benchmark index gained 56.04% during the same period.
Banking and Financial Services Remain Core Operations
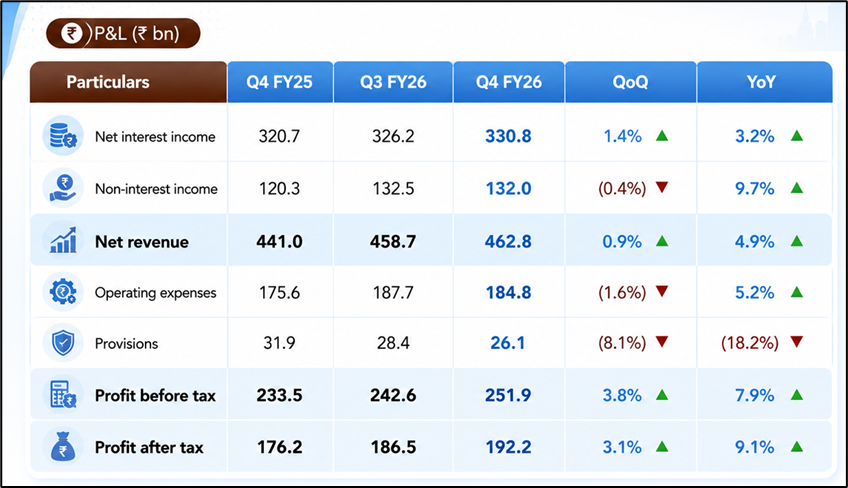
HDFC Bank Limited is engaged in banking and financial services operations across retail banking, wholesale banking, treasury operations and digital banking services.
Headquartered in Mumbai, the bank remains India’s largest private sector bank by assets. The lender also maintains a significant presence across loans, deposits, payment services and wealth management businesses.
Source: company Filing
Key Risks
- Rising interest rates may impact loan growth and borrowing demand.
- Higher credit costs could affect profitability and asset quality.
- Regulatory changes may influence banking sector margins and operations.
- Increased competition may pressure deposit growth and lending spreads.
Summary
HDFC Bank (NSE:HDFCBANK) shares declined 2% during May 27, 2026 trading, with the stock remaining below its 52-week high levels. The bank witnessed heavy trading volumes and high deliverable participation during the session. Despite its leadership position in India’s banking sector, the stock has underperformed benchmark indices across several medium- and long-term periods amid broader market and sector-related pressures.
FAQs
Q: Why did HDFC Bank shares fall on May 27, 2026?
A: The stock declined 2% amid selling pressure during the trading session on NSE.
Q: What is HDFC Bank’s 52-week high level?
A: HDFC Bank touched its 52-week high of INR 1,020.50 in October 2025.
Q: What businesses does HDFC Bank operate in?
A: The bank operates across retail banking, wholesale banking, lending and financial services businesses.