
A near-monopoly exchange that nearly destroyed itself through a technology failure, then rebuilt with astonishing speed to deliver 130% returns in twelve months, 74% operating margins, and ₹937 Cr in trailing profits. The full story of MCX's numbers demands careful reading.
There are perhaps a dozen companies listed on Indian exchanges that can legitimately claim monopoly-level market dominance in their sector. Of those, fewer still have delivered the combination of operational recovery, financial transformation, and share price performance that Multi Commodity Exchange of India Limited (NSE: MCX) has produced over the past eighteen months. On 2 April 2026, MCX trades at ₹2,374 — down 3.87% on the day but sitting on a one-year return of 130%, a three-year price CAGR of 101%, and a five-year CAGR of 52%. The stock has risen from a 52-week low of ₹905 to a high of ₹2,706 — a near-tripling from trough to peak within a single year.
The business generating these returns is not a high-growth technology startup or a newly discovered natural resource. It is a regulated financial infrastructure company — India's first listed, national-level electronic commodity derivatives exchange, which commenced operations in November 2003 and has operated under SEBI regulation throughout its existence. MCX holds a 95.9% share of India's commodity futures market in FY2024 — a dominance so complete that its nearest competitor, NCDEX, accounts for just 3.9% of the market. In precious metals and energy, MCX's grip approaches totality: 100% share in precious metals and stones, 99.61% in energy, and 99.80% in base metals. Only in agricultural commodities — where NCDEX has traditionally been stronger — does MCX's share fall to a modest 2.65%.
Understanding how a company with this degree of structural dominance nearly collapsed, then rebuilt itself into one of India's most profitable financial businesses, is one of the more instructive stories in recent Indian capital markets history.
The Collapse and Recovery: From 9% OPM to 74%
The most arresting feature of MCX's financial history is not its current strength but the depths from which it has recovered. A glance at the annual operating profit margin trajectory tells a story of near-catastrophic deterioration followed by extraordinary restoration:
Chart 1: MCX Annual Operating Profit Margin — The Full Cycle
Data Source: REFINITIV, Analysis: Kalkine Group
────────────────────────────────────────────────────
The FY2024 figure — a 9% operating profit margin on ₹684 Cr of revenue — represents the nadir of MCX's technology transition crisis. The exchange had been attempting to migrate from its legacy trading platform to a new system provided by 63 Moons Technologies, and the transition was deeply troubled, resulting in elevated technology costs, operational disruptions, and a collapse in profitability that alarmed investors and regulators alike.
The recovery from that 9% OPM to 60% in FY2025 and 67% on a TTM basis — with Q3 FY2026 delivering a remarkable 74% OPM — is one of the sharpest operational turnarounds in recent Indian financial sector history. Revenue has simultaneously accelerated from ₹684 Cr (FY2024) to ₹1,113 Cr (FY2025) to ₹1,704 Cr (TTM) — a 149% increase in top-line in just two years. The combination of revenue acceleration and margin restoration has produced explosive earnings growth that has driven the extraordinary share price performance.
Chart 2: Quarterly Revenue and Profitability — The Acceleration
Data Source: REFINITIV, Analysis: Kalkine Group
─────────────────────────────────────────────────────
The December 2025 quarter is a landmark in MCX's financial history. Revenue of ₹666 Cr — more than the entire FY2023 annual revenue of ₹514 Cr, delivered in a single quarter — combined with a 74% operating margin to produce net profit of ₹401 Cr and EPS of ₹15.73. The quarterly profit growth of 150.64% year-on-year (from ₹160 Cr in December 2024 to ₹401 Cr) is exceptional even by the standards of India's highest-growth financial companies.
The trajectory from loss-making in September 2023 (–₹19 Cr net profit) to ₹401 Cr profit in December 2025 — a swing of ₹420 Cr in eight quarters — is a transformation almost without parallel in India's exchange sector. It reflects the combination of resolved technology costs, accelerating trading volumes across commodity derivatives, and the structural operating leverage of an exchange business where incremental revenue flows through to profit at very high marginal rates.
The Monopoly Economics: Why Exchange Businesses Are Exceptional
To understand why MCX's financial profile looks the way it does — and why the margin recovery has been so explosive — requires understanding the fundamental economics of exchange businesses.
MCX earns transaction fees on every futures and options contract traded on its platform. These fees are largely fixed per contract or per lot, meaning revenue scales directly with trading volumes. The cost structure, by contrast, is almost entirely fixed — technology infrastructure, regulatory compliance, staff, and corporate overhead do not increase proportionally with volume. This creates an extraordinarily powerful operating leverage dynamic: once fixed costs are covered, virtually every additional rupee of transaction fee revenue falls directly to operating profit.
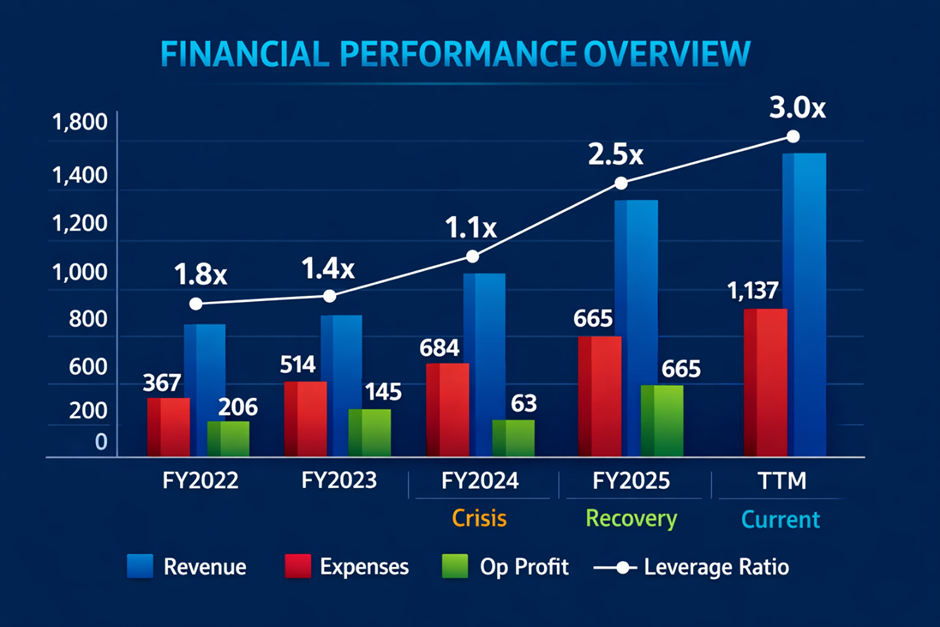
This is precisely what the FY2024-to-FY2025 recovery illustrates. The technology crisis of FY2024 artificially inflated the expense base — ₹621 Cr of expenses against ₹684 Cr of revenue left only ₹63 Cr of operating profit. As technology costs normalised, the expense base dropped to ₹447 Cr in FY2025 even as revenue surged to ₹1,113 Cr — producing ₹665 Cr of operating profit. On a TTM basis, expenses of ₹567 Cr against revenue of ₹1,704 Cr deliver ₹1,137 Cr of operating profit. The fixed cost base has barely moved while revenue has more than doubled.
Chart 3: Annual Revenue vs Expenses — The Operating Leverage Engine
Data Source: REFINITIV, Analysis: Kalkine Group
──────────────────────────────────────────────────────
The leverage ratio — revenue divided by expenses — captures the operating leverage dynamic precisely. In FY2024 at the crisis trough, MCX earned ₹1.10 of revenue for every ₹1 of expenses. On a TTM basis, it earns ₹3.00. This is the fundamental economic engine that drives exchange businesses — and MCX, as a near-monopoly with 95.9% market share, operates it with fewer competitive constraints than virtually any other exchange globally.
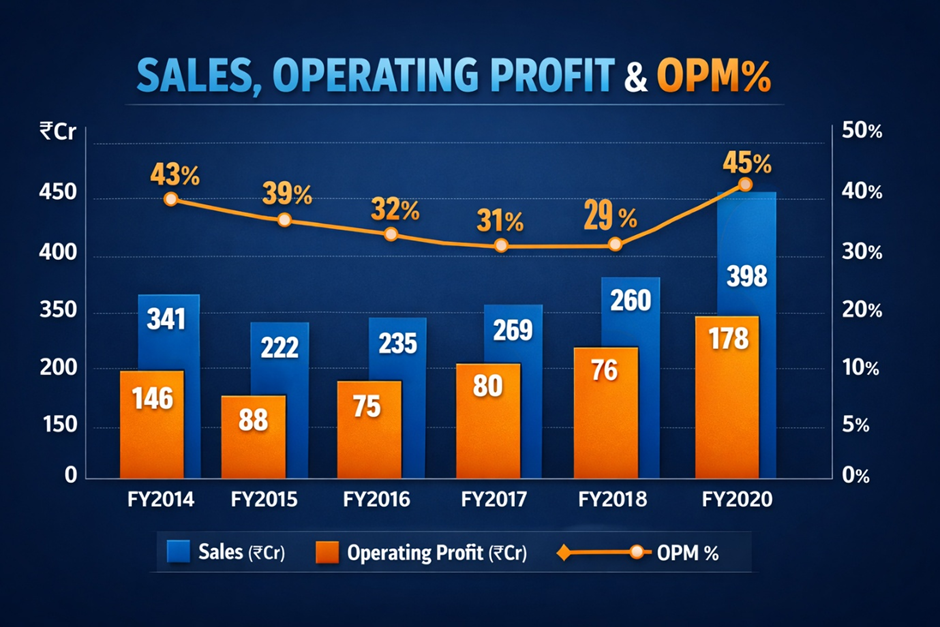
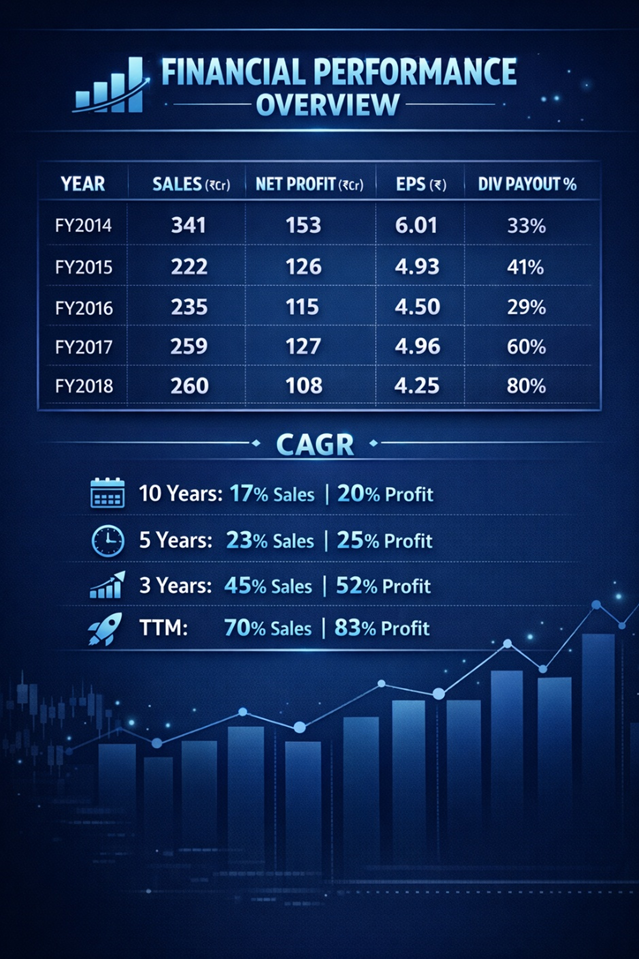
Full Year Financial Performance: A Decade in Context
Data Source: REFINITIV, Analysis: Kalkine Group
──────────────────────────────────────────────────────
The long-run data reveals a business that has compounded sales at 17% and profits at 20% over a decade — solid, if not spectacular, for an exchange business. The three-year acceleration to 45% sales CAGR and 52% profit CAGR reflects the post-crisis recovery phase. TTM growth of 70% revenue and 83% profit represents the peak of the recovery cycle — rates that will almost certainly moderate as the base effect normalises, but which confirm the fundamental re-rating of the business is backed by real earnings delivery.
The dividend history deserves specific attention. MCX has maintained a healthy dividend payout ratio of 46.5% on average — returning substantial capital to shareholders consistently. The FY2025 payout ratio dropped to 27% (from 47% in FY2024) even as absolute profits surged, suggesting the company may be retaining capital for investment or expansion. The current dividend yield of 0.24% at the current price reflects the significant share price appreciation — the absolute dividend per share has grown substantially but the yield has compressed with the stock's re-rating.
The Balance Sheet: Debt-Free, Capital-Light, Investment-Rich
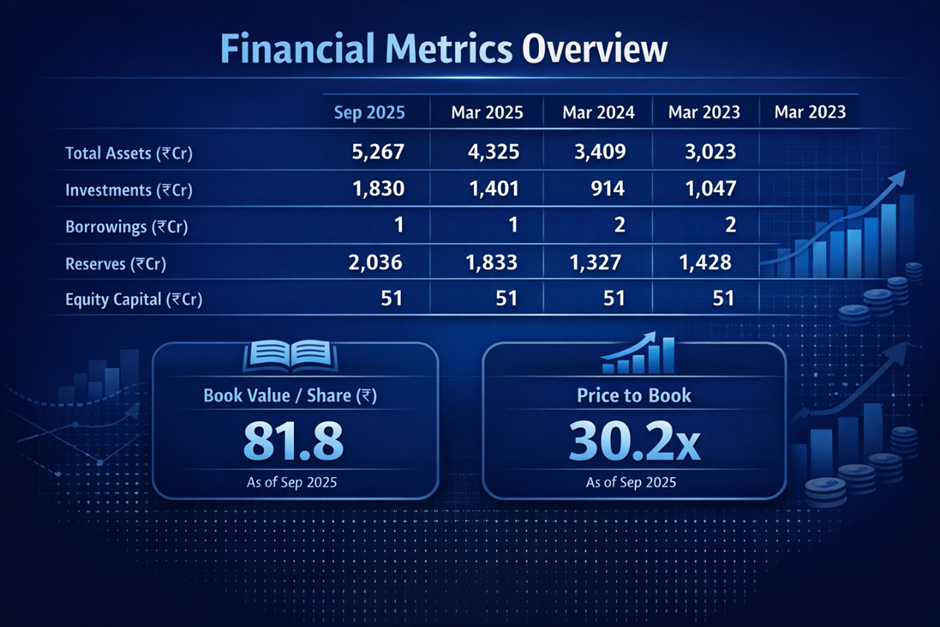
Data Source: REFINITIV, Analysis: Kalkine Group
──────────────────────────────────────────────────────────────────
The balance sheet profile is that of an exceptionally capital-light, financially pristine business. Borrowings of just ₹1 Cr against total assets of ₹5,267 Cr represents a debt-to-asset ratio of 0.02% — effectively zero.
The investment portfolio of ₹1,830 Cr (September 2025) — representing 35% of total assets — is a characteristic feature of exchange businesses that hold regulatory deposits, settlement guarantee funds, and surplus liquidity in financial instruments. This embedded investment pool generates other income of ₹98 Cr (FY2025) and ₹121 Cr (TTM), providing a recurring income floor independent of trading volumes.
The negative working capital days (–390 days in FY2025) is a structural feature of exchange businesses — members pay margin money upfront before trading, creating a permanent float of client funds that sits as a liability on MCX's balance sheet but generates investment income. Working capital is deeply negative because the business receives cash before it provides services — the opposite of most industrial businesses.
The price-to-book ratio of 30.2x is elevated — flagged by Screener.in as the primary valuation concern — but must be contextualised. For an exchange business with near-monopoly status, zero debt, high ROE, and a predominantly intangible value base (regulatory licence, technology platform, network effects), book value is not the appropriate valuation anchor. The relevant metrics are earnings multiples and return on capital — both of which tell a considerably more favourable story.
Return Metrics: The Transformation Is Real
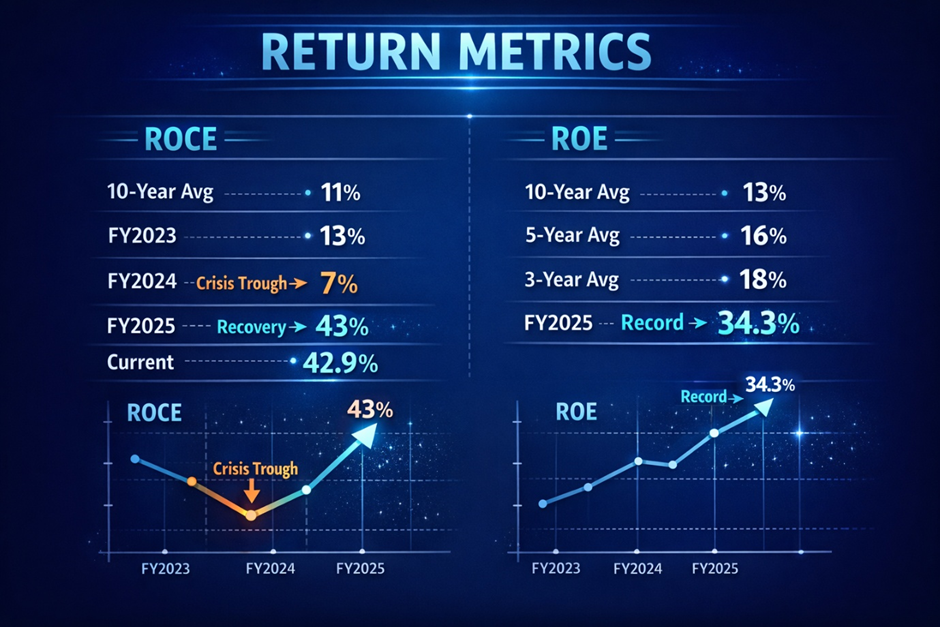
Data Source: REFINITIV, Analysis: Kalkine Group
──────────────────────────────────────
The return on capital employed of 42.9% and ROE of 34.3% represent the strongest capital efficiency metrics in MCX's listed history. These are not merely recovery numbers — they are genuinely exceptional returns for any regulated financial infrastructure business globally. For context, the London Stock Exchange Group and Intercontinental Exchange (ICE) — among the world's most profitable exchange operators — typically deliver ROCEs in the 15–25% range. MCX's 42.9% ROCE reflects the extraordinary economics of near-monopoly exchange operation in a rapidly growing derivatives market.
Cash Flow: Exceptional Quality Confirmed
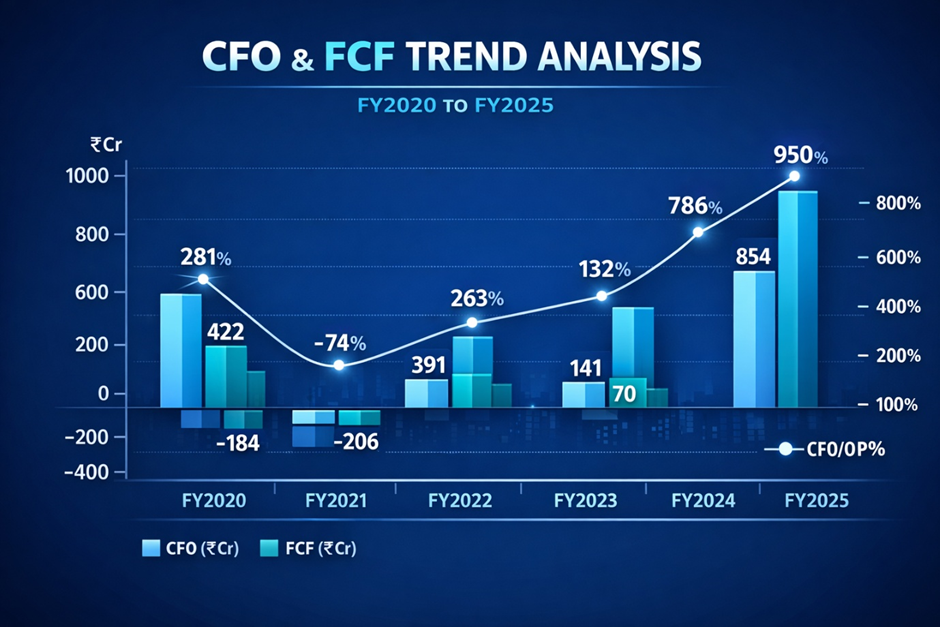
Data Source: REFINITIV, Analysis: Kalkine Group
──────────────────────────────────────────────
Cash from operations of ₹950 Cr in FY2025 against net profit of ₹560 Cr — a CFO/Net Profit ratio of 170% — confirms exceptional earnings quality. The business is generating significantly more cash than its reported profits, reflecting the float income from client margin deposits and the timing of fee collections. Free cash flow of ₹854 Cr in FY2025 is the highest in the company's history and provides substantial capital for dividends, investments, and potential new product development.
Latest Announcements: Technical Glitches and Tax Demand
Source: NSE/BSE filings
31 March 2026 — Settlement Guarantee Fund Transfer (January 28 Technical Glitch): MCX's clearing subsidiary MCXCCL transferred ₹50 Lakh to the Core Settlement Guarantee Fund on 27 March 2026 as a consequence of a technical glitch that occurred on 28 January 2026. This is the second such transfer disclosed in the recent announcement period — a similar ₹50 Lakh transfer was made on 23 March 2026 relating to a technical glitch on 23 December 2025.
These disclosures deserve careful attention from investors. Two technical glitches significant enough to trigger regulatory Settlement Guarantee Fund contributions within a two-month period — December 2025 and January 2026 — raise questions about the reliability of MCX's current technology platform. For an exchange business whose entire value proposition rests on the integrity and continuity of its trading infrastructure, technology reliability is not merely an operational concern but an existential one. The ASIC critique of ASX's operational reliability (see Article 2 in this series) provides a salutary parallel — technology failures at exchanges carry systemic risk implications that regulators take extremely seriously.
29 March 2026 — Income Tax Demand of ₹9.97 Cr on MCXCCL: MCX's clearing subsidiary received an Income Tax demand of ₹9,97,13,980 (approximately ₹9.97 Cr) on 28 March 2026. The company has announced its intention to file an appeal. At ₹9.97 Cr against TTM net profit of ₹937 Cr, this is a financially immaterial amount — representing approximately 1.1% of annual profit. However, tax disputes at regulated financial subsidiaries can have reputational and procedural implications beyond their financial quantum, and investors should monitor the outcome of the appeal.
25 March 2026 — Trading Window Closure: The trading window closed from 1 April 2026 until 48 hours after audited results for the quarter and full year ending 31 March 2026 — confirming Q4 FY2026 results are imminent. Given the December 2025 quarter delivered ₹401 Cr net profit (₹15.73 EPS), the market will be watching Q4 FY2026 results with significant interest to assess whether the December quarter performance is sustainable or represented an exceptional peak.
Shareholding: Institutionally Dominated, No Promoter
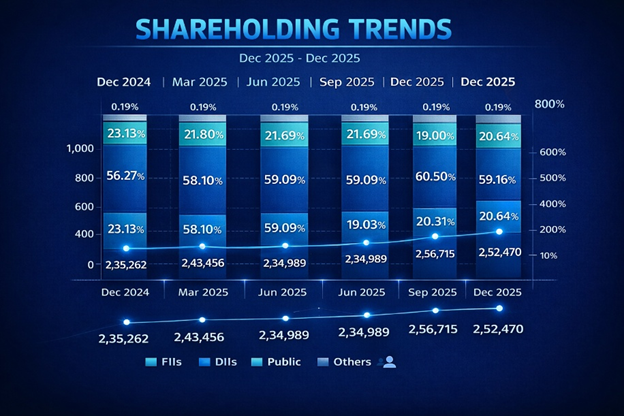
Data Source: REFINITIV, Analysis: Kalkine Group
────────────────────────────────────────────────────────────────
MCX's shareholding pattern is unique among the companies examined in this series — there is no identifiable promoter group. The company is effectively institutionally owned, with DIIs holding 59.16% and FIIs holding 20.64% — combined institutional ownership of 79.80%. This level of institutional dominance is characteristic of a mature, well-covered financial sector stock rather than a small-cap momentum play.
DII ownership has been rising steadily — from 52.70% in March 2023 to 59.16% in December 2025 — reflecting sustained domestic mutual fund and insurance company accumulation. This is a powerful signal of institutional conviction in MCX's long-term earnings story. FII ownership, while fluctuating between 19% and 27%, has remained substantial throughout — confirming the stock has global investor recognition.
The number of shareholders has grown from 1,65,446 (September 2023) to 2,52,470 (December 2025) — a 53% increase in registered shareholders over two years, reflecting the stock's rising profile among retail investors following its extraordinary price performance.
Peer Comparison: A Three-Horse Race
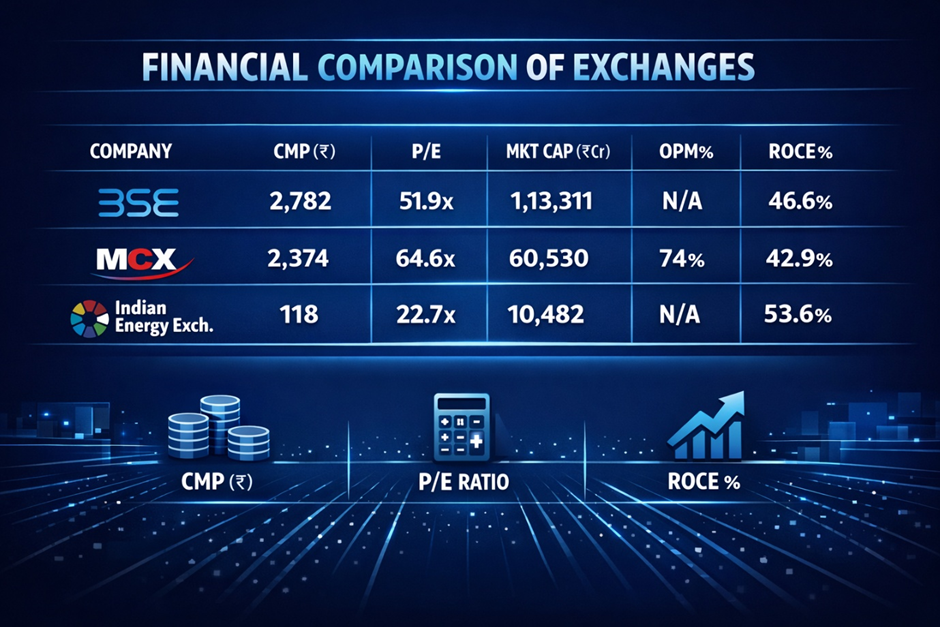
Data Source: REFINITIV, Analysis: Kalkine Group
────────────────────────────────────────────────────────────────────
India's exchange sector is a concentrated oligopoly — just three listed exchange operators, each with near-monopoly positions in their respective market segments. BSE dominates equity settlement infrastructure, IEX dominates electricity derivatives, and MCX dominates commodity derivatives.
MCX trades at the highest P/E of the three at 64.6x — a premium that reflects its superior top-line growth (quarterly sales growth of 120.86% versus BSE's 61.97% and IEX's 9.59%) and the explosive earnings recovery trajectory. BSE at 51.9x and IEX at 22.7x both trade at significant discounts to MCX. The question for investors is whether the MCX premium is justified by the superior growth rate, or whether the extraordinary Q3 FY2026 revenue of ₹666 Cr — more than double the year-ago figure — reflects a volume spike that will not be sustained.
Valuation: Extraordinary Business, Full Price
At 64.6x TTM P/E, MCX is priced for continued exceptional performance. The valuation is demanding but not indefensible for a business with near-monopoly market position, zero debt, 42.9% ROCE, 74% operating margins, and accelerating volume growth in India's rapidly expanding commodity derivatives market. The central question is whether the December 2025 quarterly revenue of ₹666 Cr — 79% higher than the September 2025 quarter's ₹374 Cr — reflects a structural step-change in volumes or a cyclical spike driven by elevated commodity price volatility.
If Q4 FY2026 revenue sustains near ₹600–700 Cr, the TTM P/E will compress rapidly as full-year FY2026 earnings become visible. If it reverts toward the ₹300–400 Cr range seen in the preceding three quarters, the multiple will look considerably more stretched and re-rating risk becomes real.
The Technology Risk: Two Glitches in Two Months
The most significant near-term risk factor for MCX is one that the financial metrics alone cannot fully capture — the technology platform reliability concern evidenced by two Settlement Guarantee Fund contributions in consecutive months. The 28 January 2026 and 23 December 2025 technical glitches, while financially immaterial at ₹50 Lakh each, signal operational fragility in the infrastructure that is MCX's entire reason for existing. SEBI's oversight of exchange operational resilience is rigorous, and any pattern of recurring technical failures risks regulatory intervention, trading suspensions, or mandatory infrastructure investment that could increase costs and disrupt the operating leverage dynamics that have driven the recent profitability surge.
Verdict: Outstanding Business, Requires Patience on Entry
MCX is one of India's most structurally compelling listed businesses. Near-monopoly market share, capital-light model, zero debt, 42.9% ROCE, and 74% operating margins form a combination that is extraordinarily rare in any market globally. The ten-year earnings CAGR of 20% and price CAGR of 31% confirm this is a genuine long-term wealth creator.
But the stock at ₹2,374 and 64.6x TTM P/E is priced for near-perfection. The December 2025 quarter revenue of ₹666 Cr needs to be tested for sustainability — a single quarter's performance, however extraordinary, does not establish a new permanent run-rate. The technology glitches in December 2025 and January 2026 are a risk factor that requires monitoring. And the trading window closure ahead of Q4 FY2026 results means the market is about to receive information that will either validate or challenge the current valuation.
For long-term investors: MCX's structural position is genuinely exceptional and the 10-year price CAGR of 31% reflects durable value creation. The stock deserves a place in any portfolio seeking exposure to India's financial infrastructure growth. Accumulate on any meaningful correction toward the ₹2,000–₹2,100 range.
For tactical investors: Q4 FY2026 results — imminent given the trading window closure — are the critical near-term catalyst. Strong sequential revenue (₹600 Cr+) would validate the current price. Any material sequential decline from the ₹666 Cr December 2025 peak would trigger significant re-rating risk at 64.6x P/E.
Key level to watch: ₹905 — the 52-week low — represents the floor of the recovery. A close below ₹2,000 would signal the market is materially questioning the sustainability of recent earnings.