
Highlights
- Vedanta shares gained more than 3% during Tuesday’s NSE trading session.
- The stock witnessed heavy trading volumes during intraday market activity.
- Exchange data highlighted promoter encumbrance exceeding 50% in the scrip.
Vedanta Limited (NSE:VEDL) shares traded higher during the May 12 session on the National Stock Exchange. The stock was trading at INR 307.70, up 3.12% from the previous close of INR 298.40.
The stock opened at INR 298.10 and touched an intraday high of INR 309.90 during the session. The intraday low remained at INR 298.10.
Vedanta shares continue trading significantly below their 52-week high of INR 795.00 recorded on April 21, 2026.
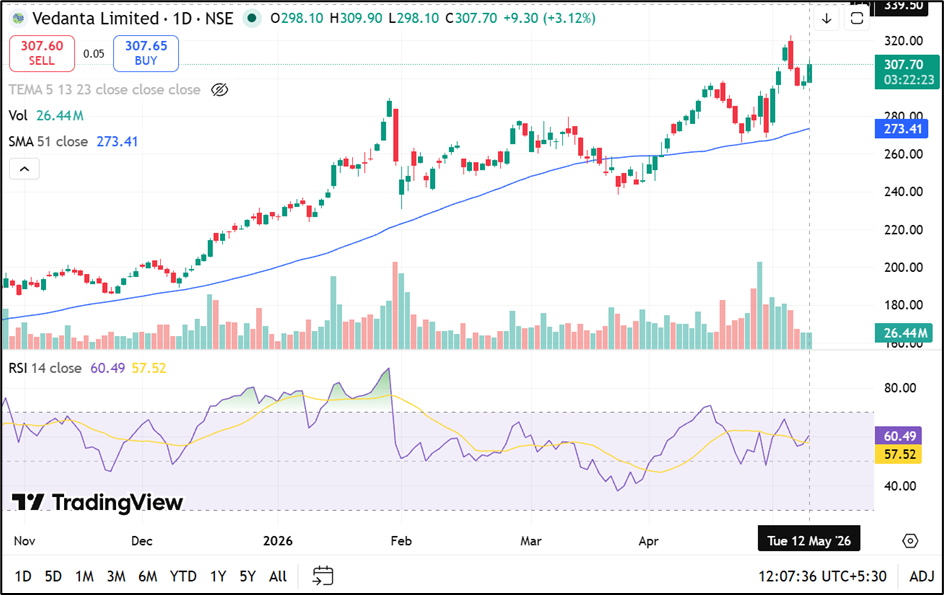
Source: TradingView
Trading Volumes and Market Capitalisation
The stock recorded traded volume of 262.34 lakh shares during the session, while traded value stood at INR 801.86 crore.
The company’s total market capitalisation stood at INR 1,20,146.67 crore, while free float market capitalisation was INR 52,061.00 crore. The stock’s VWAP during the session was INR 305.66.
Deliverable quantity as a percentage of traded quantity stood at 49.99%, while the impact cost remained low at 0.02.
Stock Performance Compared With NIFTY NEXT 50
Vedanta shares underperformed the NIFTY NEXT 50 index across several longer-term periods.
The stock declined 58.77% over one month compared with a 2.84% rise in the benchmark index. On a year-to-date basis, Vedanta shares fell 49.02%, while the benchmark index remained nearly flat.
Over one year, the stock declined 29.54%, compared with a 6.89% gain in the NIFTY NEXT 50 index.
However, Vedanta shares gained 11.69% over three years and 8.92% over five years.
Volatility and Business Operations
The stock recorded annualised volatility of 43.37%, while daily volatility stood at 2.27.
Vedanta touched its 52-week low of INR 268.70 on April 30, 2026. The applicable margin rate stood at 18.17%, while the face value remained INR 1 per share.
Exchange data also indicated overall encumbered promoter shareholding exceeding 50% in the scrip.
According to the company profile, Vedanta operates across zinc, lead, silver, aluminium, copper, iron ore, oil and gas, power generation, steel manufacturing, port operations, and glass substrate manufacturing businesses.
Q4 FY26 Highlights
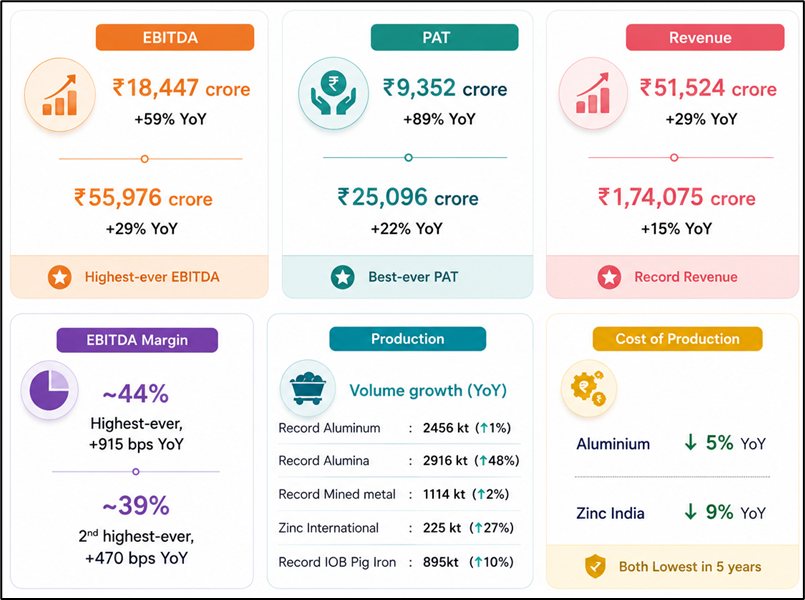
Source: Company Filing
Key Risks Investors Monitor
- Commodity price fluctuations may impact revenue and profitability trends.
- High promoter encumbrance remains a significant monitoring factor.
- Global economic slowdown could affect industrial metal demand.
- Regulatory changes may influence mining and energy operations.
Summary
Vedanta (NSE:VEDL) shares rose more than 3% during Tuesday’s NSE trading session amid heavy market participation. The stock continued trading well below its 52-week high while investors monitored commodity market trends and promoter encumbrance indicators. Market participants also remain focused on global metal demand, mining sector developments, and fluctuations across energy and natural resource markets.
FAQs
Q: What was Vedanta share price on May 12, 2026?
A: Vedanta shares traded at INR 307.40, up 3.02% during the NSE session.
Q: What is the 52-week high level of Vedanta shares?
A: The stock’s 52-week high was INR 795.00, recorded on April 21, 2026.
Q: What key indicator was highlighted for Vedanta stock?
A: Exchange data indicated promoter encumbrance exceeding 50% in the company’s shares.