
Highlights
- Redington shares gained nearly 8% during Thursday's trading session.
- The stock outperformed its benchmark across weekly and monthly periods.
- Trading value crossed Rs 900 crore amid elevated market participation.
Shares of Redington Limited (NSE:REDINGTON) rose 7.81% on June 18, 2026, closing at Rs 268.37 compared with the previous close of Rs 248.92. The stock opened at Rs 253.24 and touched an intraday high of Rs 274.83 before easing slightly from the day's peak.
The stock traded within a range of Rs 251.00 to Rs 274.83 during the session, reflecting heightened investor activity. The volume-weighted average price (VWAP) stood at Rs 266.42.
Redington was among the actively traded stocks of the day, supported by significant trading volumes and value turnover.
Trading Volumes Cross 341 Lakh Shares
Exchange data showed that 341.11 lakh shares changed hands during the trading session. The total traded value stood at Rs 908.80 crore.
Despite the large volume, deliverable quantity accounted for 19.66% of total traded shares, indicating that a substantial portion of activity was driven by short-term market participation.
The stock's impact cost remained at 0.05, suggesting relatively efficient trade execution despite the elevated turnover.
Recent Performance Outpaces Benchmark
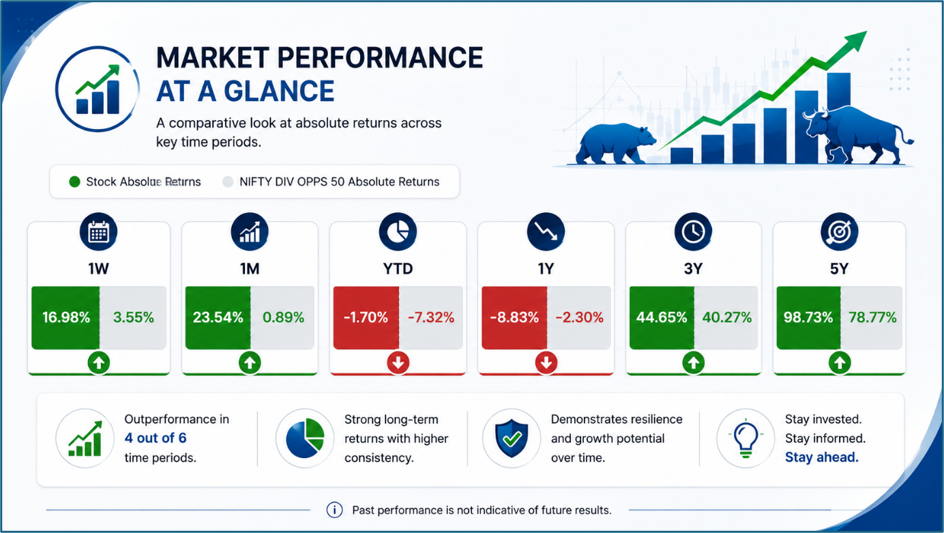
Redington has outperformed the NIFTY Dividend Opportunities 50 Index across several recent periods.
Over the past week, the stock delivered returns of 16.98%, compared with 3.55% for the benchmark index. During the last month, Redington gained 23.54%, significantly ahead of the benchmark's return of 0.89%.
On a year-to-date basis, however, the stock recorded a decline of 1.70%, although this was better than the benchmark's fall of 7.32%.
The stock has also generated returns of 44.65% over three years and 98.73% over five years, according to exchange data.
Source: NSE
Trading Below Its 52-Week High
Redington's 52-week high stands at Rs 334.80, recorded on June 30, 2025. The stock's 52-week low was Rs 191.31, touched on April 2, 2026.
At the current market price of Rs 268.37, the stock remains below its annual high but considerably above the low reached earlier this year.
The recovery from the yearly low highlights the stock's movement over recent months, although it continues to trade below levels seen during the middle of 2025.
Market Capitalisation Exceeds Rs 21,000 Crore
As of June 18, 2026, Redington's total market capitalisation stood at Rs 21,143.09 crore. The company's free-float market capitalisation was Rs 16,024.64 crore.
The company is classified under the Trading & Distributors industry and is a constituent of the NIFTY Smallcap 100 index.
Since its listing on February 15, 2007, Redington has remained part of India's technology distribution and supply-chain ecosystem, serving multiple product categories across markets.
Valuation And Volatility Indicators
Redington's reported price-to-earnings ratio stood at 15.15, while its adjusted P/E ratio was 14.08.
The stock's daily volatility was reported at 2.90%, with annualised volatility at 55.40%. These figures indicate the degree of price movement experienced by the stock over different periods.
The applicable margin rate was 22.86%, while the face value of each share remained Rs 2.
Market participants often monitor valuation and volatility metrics alongside business performance to assess stock movements and trading activity.
Investor Focus Remains On Distribution Sector
Companies operating in the trading and distribution industry are often influenced by technology demand, supply-chain trends, inventory management, currency movements and broader economic activity.
As a participant in this segment, Redington remains part of investor discussions around technology distribution, enterprise demand and market conditions affecting product sales across various categories.
Recent price movements have also drawn attention to the stock's performance relative to its benchmark and broader small-cap universe.
Key Risks
- Technology demand slowdowns may affect distribution volumes.
- Currency fluctuations can impact profitability and margins.
- Competitive pressures may influence market share.
- Supply-chain disruptions could affect business operations.
Summary
Redington shares climbed 7.81% on June 18, 2026, closing at Rs 268.37 after touching an intraday high of Rs 274.83. The stock outperformed its benchmark over the past week and month, while trading volumes exceeded 341 lakh shares. With a market capitalisation of over Rs 21,000 crore, Redington remains a closely watched stock within the trading and distribution sector.
FAQs
Q: Why did Redington shares rise nearly 8% on June 18, 2026?
A: The stock gained 7.81% during the session amid heavy trading volumes and active market participation.
Q: How has Redington performed compared with its benchmark recently?
A: The stock outperformed the NIFTY Dividend Opportunities 50 Index over both one-week and one-month periods.
Q: What is Redington's current 52-week trading range?
A: The stock's 52-week high is Rs 334.80 and its 52-week low is Rs 191.31.