
Highlights
- Ambuja Cements shares rose over 1% during intraday trading on May 14, 2026.
- The stock traded near INR 443 with steady buying across cement counters.
- Trading volume crossed 20 lakh shares amid sector-wide activity.
Shares of Ambuja Cements Limited (NSE:AMBUJACEM) traded higher on May 14, 2026, supported by mild buying interest across construction-linked and cement sector stocks. The stock traded at INR 444.40, up 1.37% from the previous close of INR 438.40. Ambuja Cements opened at INR 438.90 and touched an intraday high of INR 447.15.
The session low stood at INR 433.25, while VWAP was recorded at INR 441.80. The stock remained below its 52-week high of INR 624.95 recorded on July 22, 2025, while the 52-week low stands at INR 394.
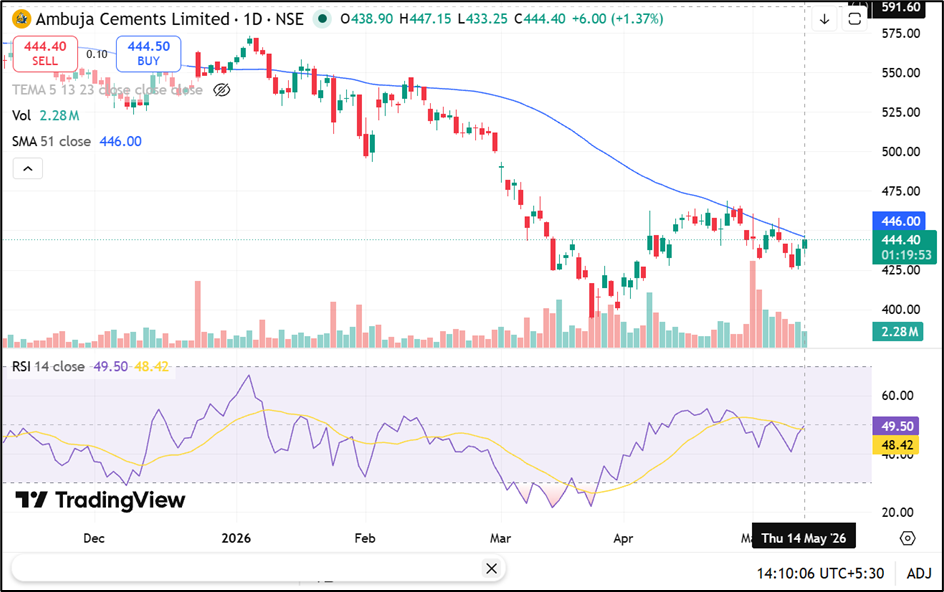
Source: Trading View
Trading Activity Remains Stable
Trading activity remained steady with 20.99 lakh shares exchanged during the session. Traded value stood at INR 92.73 crore. Deliverable quantity accounted for 41.13% of total traded volume, while impact cost remained at 0.03.
The company’s market capitalisation stood at approximately INR 1.09 lakh crore, while free float market capitalisation was INR 27,002 crore. The applicable margin rate stood at 15.56%.
Cement Sector Trends in Focus
Ambuja Cements operates with a production capacity of 31 million tonnes, supported by six integrated plants and eight grinding units across India. The company is part of the Adani Group and remains positioned within the country’s infrastructure and construction materials sector.
Market participants continued tracking cement demand trends, infrastructure spending and pricing stability across the building materials industry.
Source: company filing
Stock Performance Remains Mixed Across Periods
Ambuja Cements declined 18.32% over the past one year and 20.66% on a year-to-date basis. However, longer-term returns remain positive, with the stock gaining 8.29% over three years and 44.58% over five years.
The stock has underperformed the broader NIFTY NEXT 50 index in recent periods, reflecting pressure in cement and construction-linked demand cycles.
Volatility and Trading Metrics
The stock’s annualised volatility stood at 36.30%, while daily volatility was recorded at 1.90%. The upper price band for the session was INR 482.20, while the lower band stood at INR 394.60. Ambuja Cements remained actively traded within the mid-cap construction materials segment.
Key Risks
- Weak infrastructure demand may impact cement volume growth trends.
- Input cost fluctuations could affect operating margins.
- Intense competition in cement industry may limit pricing power.
- Cyclical slowdown in construction activity may affect earnings visibility.
Summary
Ambuja Cements (NSE:AMBUJACEM) shares gained over 1% during intraday trading on May 14, 2026, amid steady activity in cement sector stocks. The stock remains under pressure on a one-year basis but continues to reflect long-term infrastructure-driven growth potential. Investors tracked cement demand trends, pricing stability and construction sector momentum across India.
FAQs
Q: Why did Ambuja Cements shares rise on May 14, 2026?
A: The stock gained amid steady buying interest in cement and infrastructure-linked stocks.
Q: What is Ambuja Cements’ 52-week high level?
A: The stock’s 52-week high is INR 624.95 recorded on July 22, 2025.
Q: What business does Ambuja Cements operate in?
A: The company manufactures and sells cement products with plants and grinding units across India.