
Highlights
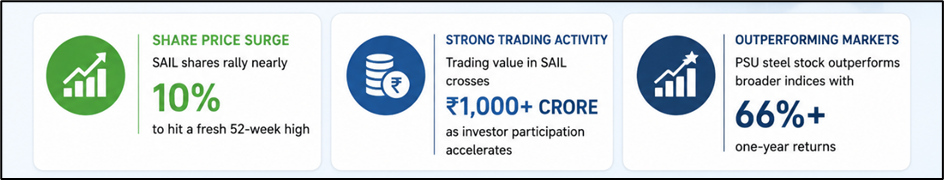
- SAIL shares surged nearly 10% during Wednesday morning trading on NSE.
- The stock touched a fresh 52-week high amid heavy investor participation.
- Trading value crossed INR 1,000 crore during the active market session.
Shares of Steel Authority of India Limited (NSE:SAIL) advanced sharply during the May 13, 2026 trading session, rising 9.60% to INR 193.00 on the National Stock Exchange. The stock opened at INR 176.31 and moved higher through the session to touch an intraday high of INR 193.69. The intraday low also remained at INR 176.31, while the previous closing price stood at INR 176.09.
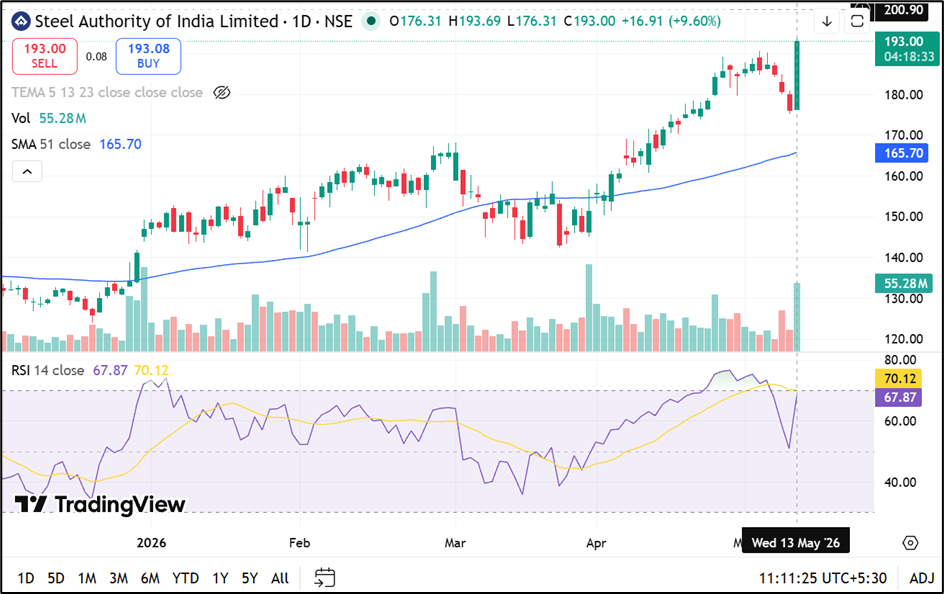
Source: TradingView
Trading Volumes and Value Remain Elevated
SAIL recorded traded volume of 546.11 lakh shares during the session, indicating elevated investor participation.
Traded value crossed INR 1,035.03 crore, while the stock reported a VWAP of INR 189.49. Impact cost stood at 0.02, reflecting liquidity in the counter during active market hours.
Deliverable quantity as a percentage of traded quantity stood at 51.38%.
Market Capitalisation and Volatility Metrics
The company’s total market capitalisation stood at approximately INR 79,818.27 crore, while free float market capitalisation was around INR 27,787.45 crore. Daily volatility stood at 2.27, while annualised volatility was recorded at 43.37. The applicable margin rate stood at 33.72%.
The stock touched its fresh 52-week high of INR 193.69 during the session, compared with a 52-week low of INR 112.40 recorded on May 12, 2025.
Source: NSE
Return Performance Shows Broad Gains
The stock gained 3.86% over the past one week and advanced 15.10% during the previous one month. On a year-to-date basis, SAIL shares rose 30.17%, significantly outperforming the NIFTY DIV OPPS 50 index, which declined 7.72% during the same period.
One-year returns stood at 66.58%, while three-year returns were reported at 132.67%. Five-year returns stood at 46.16%.
Steel Manufacturing Operations
Steel Authority of India Limited operates in the steel manufacturing sector and is among India’s public sector steel producers. The company is engaged in the production and sale of steel and related products serving multiple industrial and infrastructure sectors across the country.
Key Risks
- Global steel price fluctuations may impact revenue and profitability trends.
- Rising raw material costs could affect operational margins and production expenses.
- Infrastructure demand slowdown may influence steel consumption levels.
- Market volatility may lead to sharp movements in metal sector stocks.
Summary
Steel Authority of India Limited (NSE:SAIL) shares climbed nearly 10% during the May 13, 2026 NSE trading session, touching a fresh 52-week high amid elevated investor participation. Trading volumes exceeded 546 lakh shares while traded value crossed INR 1,000 crore. The stock also outperformed benchmark returns across one-month, year-to-date and one-year periods during the ongoing market session.
FAQs
Q: Why did SAIL shares rise sharply on May 13, 2026?
A: The stock gained amid strong buying activity and heavy trading participation during the NSE session.
Q: What was SAIL’s new 52-week high price?
A: SAIL shares touched a fresh 52-week high of INR 193.69 during the May 13, 2026 session.
Q: How much trading value was recorded in SAIL shares?
A: Traded value in SAIL shares crossed INR 1,035 crore during the active NSE session.