
Highlights
- Shree Cement shares gained more than 4% during Wednesday's trading session.
- The company reported consolidated net profit of INR 52,753 lakh in Q4 FY26.
- The stock remains nearly 20% below its 52-week high level.
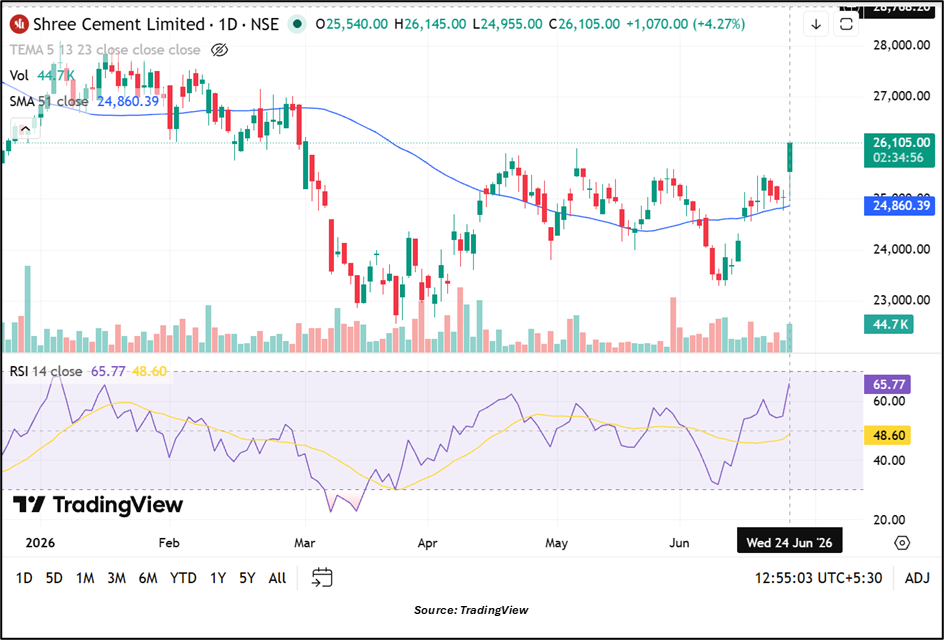
Shree Cement Limited (NSE:SHREECEM), a manufacturer and seller of cement and cement-related products, was in focus on June 24, 2026, after its shares climbed 4.27% during intraday trade. The stock was trading at INR 26,105.00 compared with the previous close of INR 25,035.00.
During the session, the stock opened at INR 25,540.00 and moved between an intraday low of INR 24,955.00 and a high of INR 26,145.00. Despite the day's gains, the share price remains below its 52-week high of INR 32,490.00 recorded on July 23, 2025. Based on the current market price, the stock is trading approximately 19.6% below its annual peak. The 52-week low stands at INR 22,550.00, touched on March 23, 2026.
Shree Cement has an installed cement production capacity of 46.4 million tonnes per annum (MTPA) and is included in the Nifty Next 50 index.
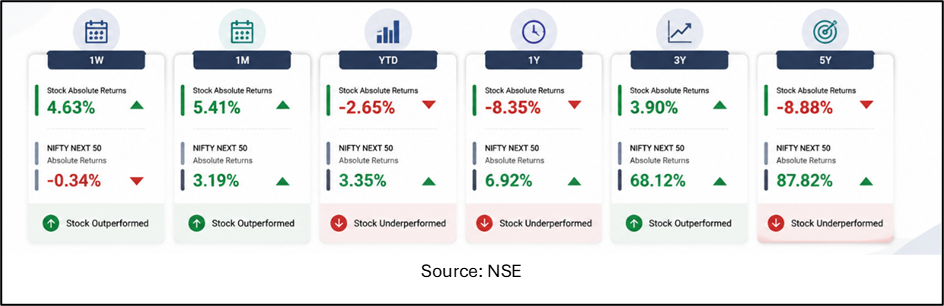
Return Performance Remains Mixed
The stock has delivered mixed returns across different investment periods. Over the last week, Shree Cement gained 4.63%, outperforming the Nifty Next 50 index, which declined 0.34% during the same period. During the past month, the stock advanced 5.41%, compared with a gain of 3.19% in the benchmark index.
However, longer-period returns remain comparatively weaker. On a year-to-date basis, the stock has declined 2.65%, while the Nifty Next 50 index gained 3.35%. Over the last one year, Shree Cement has fallen 8.35%, compared with a 6.92% rise in the benchmark.
The divergence becomes more visible over longer horizons. The stock has generated returns of 3.90% over three years and has declined 8.88% over five years, whereas the Nifty Next 50 index gained 68.12% and 87.82%, respectively, over the same periods.
Q4 FY26 Earnings Snapshot
For the quarter ended March 31, 2026, Shree Cement reported standalone total income of INR 5,75,516 lakh. Profit before tax stood at INR 67,008 lakh, while net profit came in at INR 53,199 lakh. Earnings per share (EPS) for the quarter was INR 147.45.
On a consolidated basis, total income stood at INR 6,20,216 lakh. Consolidated profit before tax was INR 66,694 lakh, while consolidated net profit reached INR 52,753 lakh. Consolidated EPS for the quarter was reported at INR 145.70.
The financial results were announced on May 6, 2026.
Valuation And Market Indicators
Shree Cement currently commands a market capitalisation of INR 94,260.95 crore, while free-float market capitalisation stands at INR 34,823.65 crore. The stock is trading at a price-to-earnings (P/E) ratio of 51.66.
Exchange data indicates that the company's P/E ratio has remained above 50 for the previous four trailing quarters. Daily volatility stands at 1.39%, while annualised volatility is 26.56%. The applicable margin rate is 12.50%.
Bull Case
Shree Cement remains one of India's major cement manufacturers with installed capacity of 46.4 MTPA. The company reported profitability in the latest quarter and the stock has outperformed the benchmark index over the past week and month. Its inclusion in the Nifty Next 50 index also places it among widely tracked large-cap companies.
Bear Case
The stock continues to trade nearly 20% below its 52-week high and has underperformed the Nifty Next 50 index across one-year, three-year and five-year periods. The valuation multiple remains elevated, with the P/E ratio staying above 50 for four consecutive trailing quarters.
Key Risks
- Fluctuations in fuel and energy costs.
- Changes in cement demand across construction sectors.
- Rising logistics and transportation expenses.
- Competitive pricing pressure within the cement industry.
Today's Share Price Performance
Shree Cement shares gained 4.27% on June 24, 2026, to trade at INR 26,105.00. The stock opened at INR 25,540.00 and touched an intraday high of INR 26,145.00 before easing slightly. Trading volume stood at 0.45 lakh shares, while traded value reached INR 114.87 crore. The stock traded above its previous close throughout most of the session and outperformed the Nifty Next 50 index on the day.
Summary
Shree Cement shares rose 4.27% on June 24, 2026, to INR 26,105.00, although the stock remains approximately 19.6% below its 52-week high of INR 32,490.00. The company reported consolidated net profit of INR 52,753 lakh for the March 2026 quarter. While recent weekly and monthly performance has been positive, longer-term returns have lagged the Nifty Next 50 index.
FAQs
Q: How far is Shree Cement from its 52-week high?
A: The stock is trading approximately 19.6% below its 52-week high of INR 32,490.00.
Q: What was Shree Cement's consolidated net profit in Q4 FY26?
A: The company reported consolidated net profit of INR 52,753 lakh for the March 2026 quarter.
Q: How has Shree Cement performed against the Nifty Next 50 index?
A: The stock outperformed recently but has lagged the benchmark over longer periods.
SEO-Friendly Question Titles
- Why Did Shree Cement Shares Jump More Than 4% Today?
- How Far Is Shree Cement Stock From Its 52-Week High?
- What Do Shree Cement's Latest Quarterly Results Show?
- Is Shree Cement Underperforming The Nifty Next 50 Index?
- What Are The Key Risks Facing Shree Cement Investors?
- How Did Shree Cement Perform In Q4 FY26?
- Why Is Shree Cement Trading Below Its Previous Peak?
- What Does Shree Cement's Valuation Indicate For Investors?