

Highlights
- TruAlt Bioenergy shares declined over 6 percent during Monday’s volatile trading session.
- The stock witnessed sharp intraday swings between daily high and low price levels.
- Exchange indicators highlighted elevated valuation levels and promoter encumbrance concerns.
Shares of TruAlt Bioenergy Limited (NSE:TRUALT) fell 7.05% percent to INR 460.20 on 25 May 2026 during active market trading. The stock opened at INR 440.00 against the previous close of INR 495.10.
During the session, the stock touched an intraday high of INR 467.00 and a low of INR 419.15, reflecting heightened volatility in trading activity. The volume weighted average price stood at INR 441.97. The stock traded within its permitted price band range of INR 396.10 to INR 594.10 during the session.
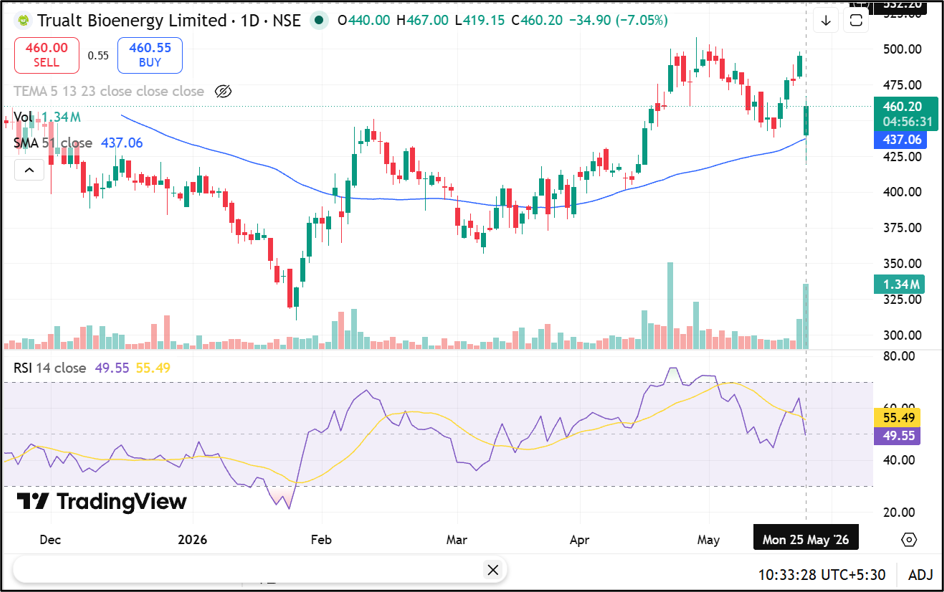
Source: Trading View
Trading Volumes Stay Active
TruAlt Bioenergy recorded traded volumes of 13.06 lakh shares, while traded value stood at INR 57.70 crore. Market participation remained active despite the sharp decline in the stock price.
The company’s total market capitalisation was reported at INR 3,987.50 crore. Free float market capitalisation stood at INR 786.91 crore. Deliverable quantity as a percentage of traded quantity was reported at 52.79 percent, indicating notable delivery-based trading activity during the session.
Performance Comparison With NIFTY IPO Index
The stock delivered mixed returns across different periods compared with the NIFTY IPO index. Over one week, TruAlt Bioenergy gained 4.64 percent against a 2.23 percent rise in the benchmark index. However, one-month returns showed a decline of 4.82 percent, compared with a 0.76 percent decline in the NIFTY IPO index.
Year-to-date returns remained positive at 16.16 percent, outperforming the benchmark return of 2.67 percent. The exchange data reflected zero percent returns across one-year, three-year and five-year periods.
Volatility Indicators Remain Elevated
The stock recorded a 52-week high of INR 549.00 on 3 October 2025, while the 52-week low stood at INR 310.20 recorded on 27 January 2026. Daily volatility for the stock was reported at 2.14, while annualised volatility stood at 40.88. The applicable margin rate remained elevated at 35 percent.
Exchange indicators also highlighted high promoter encumbrance and noted that the stock’s price-to-earnings ratio exceeded 50 during the previous four trailing quarters. Impact cost during the trading session stood at 0.12.
Key Risks Investors May Monitor
- High promoter encumbrance may affect investor sentiment significantly.
- Elevated valuation metrics can increase earnings-related volatility risks.
- Sharp intraday swings may result in wider short-term price movements.
- Higher margin requirements could limit broader trading participation.
Summary
TruAlt Bioenergy (NSE:TRUALT) shares declined more than 7 percent on 25 May 2026 amid volatile trading activity and elevated market participation. The stock moved sharply between intraday highs and lows while trading volumes remained active.
Exchange indicators highlighted promoter encumbrance concerns and elevated valuation metrics, even as year-to-date returns stayed ahead of benchmark IPO index performance.
FAQs
Q: Why did TruAlt Bioenergy shares decline on 25 May 2026?
A: The stock fell during volatile trading despite active participation and elevated traded volumes during the session.
Q: What was TruAlt Bioenergy’s intraday low on Monday?
A: The stock touched an intraday low of INR 419.15 during the trading session.
Q: What is the 52-week high level for TruAlt Bioenergy stock?
A: TruAlt Bioenergy recorded a 52-week high of INR 549.00 in October 2025.